Two-step Cluster Analysis
Discover Two-step Cluster Analysis in SPSS! Learn how to perform, understand SPSS output, and report results in APA style. Check out this simple, easy-to-follow guide below for a quick read!
Struggling with the Two-step Cluster Analysis in SPSS? We’re here to help. We offer comprehensive assistance to students, covering assignments, dissertations, research, and more. Request Quote Now!
1. Introduction
Two-step cluster analysis is an exploratory data analysis technique that allows researchers to identify groups or clusters in large datasets. Unlike other clustering methods, two-step clustering is ideal for both continuous and categorical variables, and it automatically determines the optimal number of clusters. This method is particularly useful for identifying patterns and relationships in complex datasets without prior knowledge of the number of clusters.
In SPSS, the two-step cluster analysis can handle large datasets efficiently and is designed to work with both categorical and continuous data types. It uses a unique combination of distance measures and clustering algorithms to segment data into meaningful groups, making it a popular choice for segmentation in fields like marketing, social sciences, and healthcare.
2. What is the Two-step Cluster Analysis in Statistics?
Two-step cluster analysis is a hybrid approach that combines the best features of both hierarchical and partitioning methods of clustering. The algorithm operates in two main stages: the first step involves pre-clustering data into small sub-clusters, and the second step clusters these sub-clusters into final groups using hierarchical methods. This approach efficiently handles large datasets while ensuring the best number of clusters is selected automatically based on statistical criteria.
The two-step cluster analysis uses both distance measures and a model-based clustering approach. It can handle datasets with a mixture of continuous and categorical variables by applying either log-likelihood or Euclidean distance measures, making it highly versatile for different data types and research purposes.
3. What is the Two-step Cluster Analysis Used For?
Two-step cluster analysis is widely used for segmentation in marketing research, customer profiling, and behavioral analysis. Businesses often use it to group customers based on their purchasing patterns, preferences, or demographics. This type of analysis helps organizations to target specific market segments more effectively by understanding the unique characteristics of each cluster.
Additionally, two-step cluster analysis is used in social sciences for identifying groups within survey data, such as finding patterns in individuals’ attitudes, preferences, or behaviors. Researchers can also apply it to educational or healthcare data, for instance, to categorize students based on their academic performance or patients based on their health conditions.
4. Some Definitions
- Distance Measure:
- Log-likelihood: Measures similarity between categorical and continuous variables by calculating the probability of each data point belonging to a cluster.
- Euclidean Distance: A geometric distance measure that calculates the straight-line distance between two data points in multidimensional space.
- Clustering Criterion:
- Schwarz’s Bayesian Criterion (BIC): A model selection criterion used to determine the number of clusters by penalizing model complexity.
- Akaike Information Criterion (AIC): Similar to BIC but places more emphasis on model accuracy, balancing fit and complexity when determining the number of clusters.
5. Differences / Other Types of Cluster Analysis
Cluster analysis is a broad technique used to identify natural groupings within a dataset. While two-step cluster analysis is a versatile option, SPSS offers several other clustering and classification methods that may be more appropriate depending on the type of data and research questions. Each method has its own strengths and weaknesses, and the choice depends on the structure of the data, the number of variables, and the desired output.
It is important to understand the differences between these various methods to choose the most suitable one. Here, we will briefly compare two-step cluster analysis with other commonly used methods like K-means clustering, hierarchical clustering, and decision trees, highlighting key features of each.
- Two-step Cluster Analysis: Automatically determines the number of clusters, handles large datasets, and works with both continuous and categorical data.
- K-Means Cluster Analysis: A partitioning method that requires the user to specify the number of clusters in advance. It is suitable for continuous variables.
- Hierarchical Cluster Analysis: Produces a dendrogram showing nested clusters but is computationally intensive, especially for large datasets.
- Cluster Analysis Silhouette: Measures how similar each point is to its own cluster compared to other clusters, providing a graphical evaluation of the clustering quality.
- Decision Tree Analysis: A classification method that predicts the value of a target variable based on several input variables, commonly used for categorical outcomes.
- Discriminant Analysis: A classification method that finds the linear combination of features that best separate two or more classes.
- Nearest Neighbor Analysis: A classification algorithm that assigns each observation to the nearest cluster based on the distance metric.
6. What are the Assumptions of the Two-step Cluster Analysis?
Every statistical method is based on a set of assumptions that must be met for the analysis to be valid. In the case of two-step cluster analysis, certain assumptions guide the proper use of the technique, especially when working with a mixture of categorical and continuous data. Ensuring that these assumptions are met will allow for accurate and meaningful clustering results.
Below is a list of the key assumptions that must be considered when performing two-step cluster analysis;
- Variables can be a mixture of continuous and categorical data.
- The model assumes clusters are distinct, meaning observations within a cluster are more similar to each other than to observations in other clusters.
- The distance measure used (log-likelihood or Euclidean) must suit the type of data.
- Clusters are determined based on criteria like BIC or AIC for optimal fit.
- Data should not contain outliers, as these may distort clustering results.
7. What is the Hypothesis of the Two-step Cluster Analysis?
Like any statistical analysis, two-step cluster analysis is hypothesis-driven. Although it is largely exploratory in nature, the analysis is typically conducted with an underlying expectation that meaningful clusters exist within the data. This hypothesis allows researchers to evaluate whether the data naturally segments into distinct groups or whether it represents a single homogeneous population. Here’s hypothesis of 2-step cluster analysis
- Null Hypothesis (H₀): There is no meaningful clustering in the data, and all observations belong to one homogenous group.
- Alternative Hypothesis (H₁): There are distinct clusters within the dataset, with each cluster representing a subgroup of observations that are significantly different from other clusters.
8. An Example of the Two-step Cluster Analysis
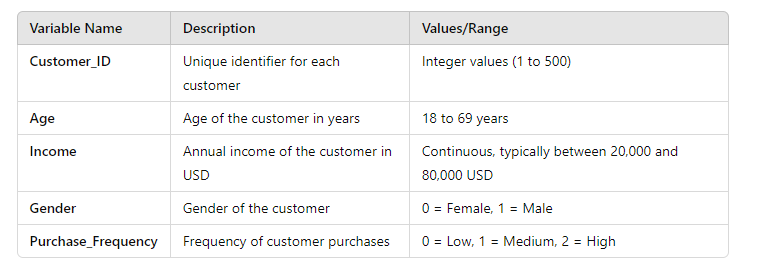
Suppose a marketing team wants to segment customers based on demographic and behavioral data to create targeted campaigns. They collect data on age, income, gender, and purchasing habits of 500 customers. The two-step cluster analysis identifies three distinct customer segments: younger customers with lower income but high spending frequency, middle-aged customers with moderate income and occasional purchases, and older customers with higher income who make luxury purchases less frequently.

Step by Step: Running TwoStep Cluster Analysis in SPSS Statistics
Let’s embark on a step-by-step guide on performing the Two-Step Cluster Analysis using SPSS
- STEP: Load Data into SPSS
Commence by launching SPSS and loading your dataset, which should encompass the variables of interest – a categorical independent variable. If your data is not already in SPSS format, you can import it by navigating to File > Open > Data and selecting your data file.
- STEP: Access the Analyze Menu
In the top menu, Go to Analyze > Classify > TwoStep Cluster.
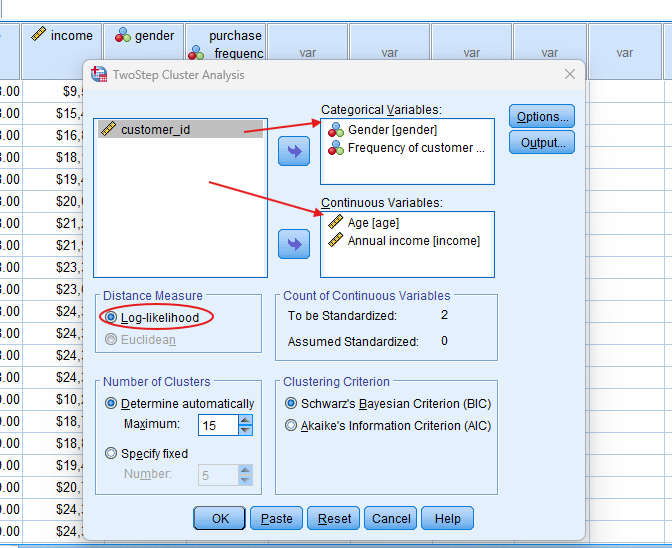
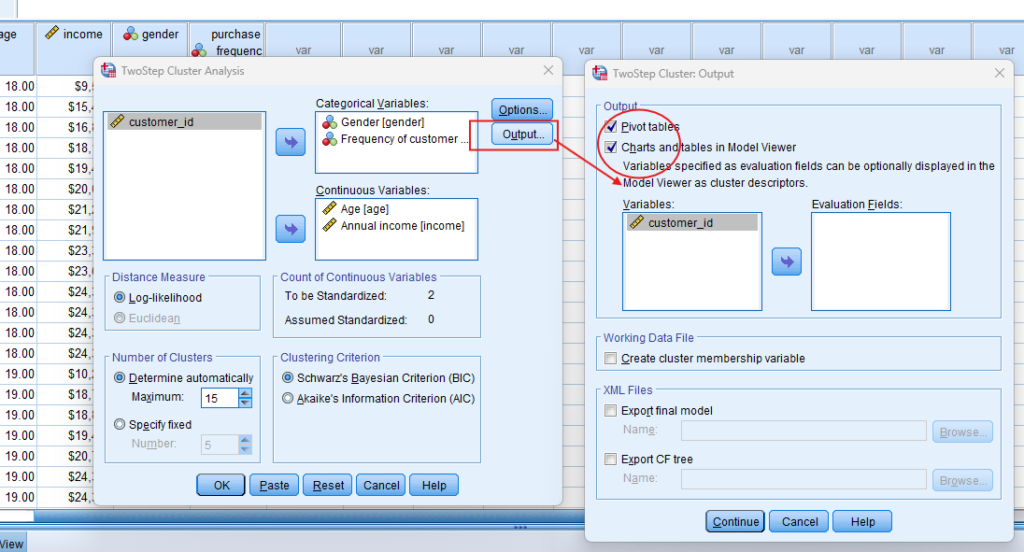
- STEP: Specify Variables
- Select your variables: Move both continuous (e.g., age, income) and categorical (e.g., gender) variables into the analysis.
- In the “Cluster” tab, choose either log-likelihood (if your data has a mix of continuous and categorical variables) or Euclidean distance (for continuous data).
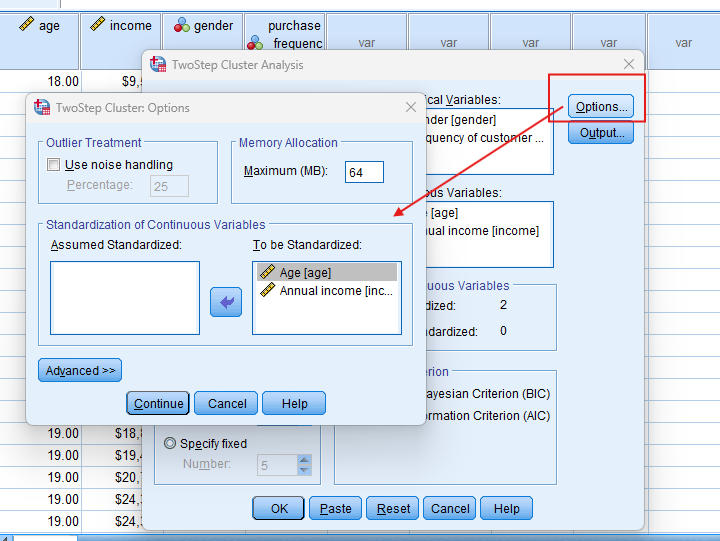
- Under “Options”, check “Automatic” to allow SPSS to determine the optimal number of clusters.
- STEP: Generate SPSS Output
- Click ‘OK’ after selecting your variables and method. SPSS will run the analysis and generate output tables and survival curves.
Note: Conducting two-step cluster Analysis in SPSS provides a robust foundation for understanding the key features of your data. Always ensure that you consult the documentation corresponding to your SPSS version, as steps might slightly differ based on the software version in use. This guide is tailored for SPSS version 25, and for any variations, it’s recommended to refer to the software’s documentation for accurate and updated instructions.
10. SPSS Output for TwoStep Cluster Analysis

11. How to Interpret SPSS Output of Two-Step Cluster Analysis
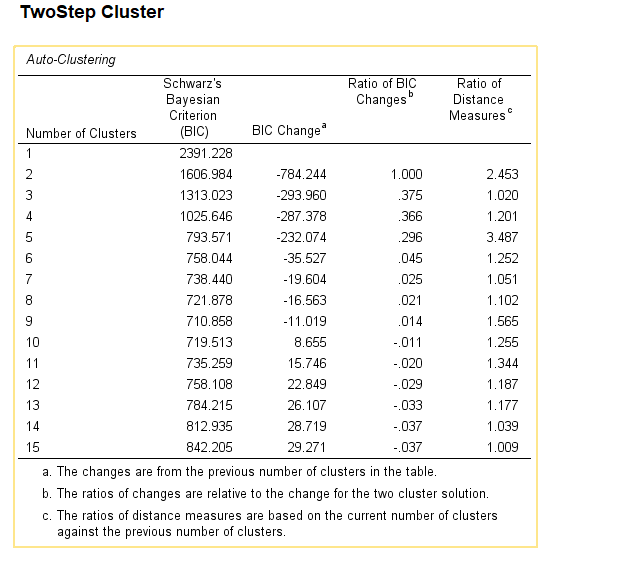
SPSS will generate output, including Auto-Clustering, Cluster Distribution, Centroids, Frequency Tables
- Cluster Summary: Shows the number of clusters identified and key statistics for each cluster, such as size and frequency.
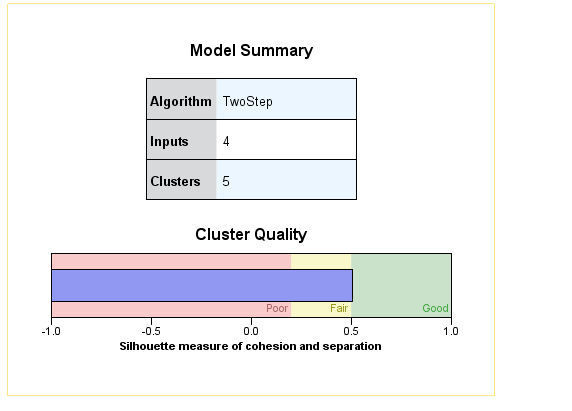
- Model Summary: Displays the BIC and AIC values used to determine the optimal number of clusters.
- Variable Importance: Lists the predictor importance for each variable used in the clustering process.
- Cluster Distribution: Shows how each variable contributes to the composition of each cluster.
12. How to Report Results of Two-Step Cluster Analysis in APA
Reporting the results of Two-Step Cluster Analysis in APA (American Psychological Association) format requires a structured presentation. Here’s a step-by-step guide in list format:
- Introduction: Briefly describe the purpose of the analysis and the theoretical background.
- Method: Detail the data collection process, variables used, and the model specified.
- Results: Present the parameter estimates with their standard errors, and significance levels.
- Figures and Tables: Include relevant plots and tables, ensuring they are properly labelled and referenced.
- Discussion: Interpret the results, highlighting the significance of the findings and their implications.
- Conclusion: Summarise the main points and suggest potential areas for further research.

Get Support For Your SPSS Data Analysis
Embark on a seamless research journey with SPSSAnalysis.com, where our dedicated team provides expert data analysis assistance for students, academicians, and individuals. We ensure your research is elevated with precision. Explore our pages;
- Statistical Advisory Service (SAS)
- Statistics Consultancy Service (SCS)
- Academic Statistical Analysis
- Hire a Dissertation Statistician
- Clinical Research Data Analysis
- Medical Data Analysis Expert
- Biostatistics Consulting
- Hire an Independent Statistician
- Help With Statistics (For PhD, For Dissertation, For Thesis, for DNP Project)
- Statistical Analysis Help for Doctorate of Nursing Practice
- SPSS Data Analysis Help for DNP
- Data Analysis – SPSS Help for Students
- SPSS Help by Subjects Area: Psychology, Sociology, Nursing, Education, Medical, Healthcare, Epidemiology, Marketing
Connect with us at SPSSAnalysis.com to empower your research endeavors and achieve impactful data analysis results. Get a FREE Quote Today!