Decision Tree Analysis
Discover Decision Tree Analysis in SPSS! Learn how to perform, understand SPSS output, and report results in APA style. Check out this simple, easy-to-follow guide below for a quick read!
Struggling with the Decision Tree Analysis in SPSS? We’re here to help. We offer comprehensive assistance to students, covering assignments, dissertations, research, and more. Request Quote Now!

1. Introduction
Decision Tree Analysis is a powerful and widely used statistical technique that classifies data by splitting it into decision-based branches. The decision tree structure helps researchers make predictions by using various input variables and systematically creating nodes and branches, resulting in an easy-to-interpret model. This analysis is a great tool for anyone looking to explore and understand complex datasets in fields such as marketing, healthcare, and risk assessment.
In SPSS, performing Decision Tree Analysis allows you to automatically generate models that classify and predict outcomes with great accuracy. By visually displaying the decision process, decision trees provide clarity and transparency, making the model easier to explain to stakeholders.
2. What is the Decision Tree in Statistics?
A Decision Tree is a classification model that works by recursively splitting data into subsets based on specific decision rules. Each internal node in the tree represents a “decision point,” and the branches indicate different outcomes based on the chosen decision rule. The terminal nodes (or leaves) represent the final classification or prediction outcomes.
Decision Trees handle both categorical and continuous data. They are known for being intuitive and interpretable, as they allow researchers to easily follow the decision-making path that leads to a particular classification.
3. What is the Decision Tree Analysis used for?
Decision Tree Analysis is used in classification tasks (e.g., customer segmentation, medical diagnosis) and regression tasks (e.g., predicting a numerical outcome). This method helps segment data into meaningful subgroups, uncover patterns, and predict outcomes based on historical data. In marketing, for example, decision trees can predict whether a customer will purchase a product based on demographics or previous purchase behavior.
Additionally, Decision Tree Analysis helps businesses make informed decisions by visualizing the paths that lead to a particular outcome. For instance, a company may use a decision tree to understand the factors contributing to customer churn and take actions to improve retention rates.
4. Some Definitions: Growing Method
- CHAID (Chi-squared Automatic Interaction Detection): Splits data based on chi-square statistics and is useful for categorical target variables.
- Exhaustive CHAID: An extended version of CHAID that examines all possible splits to create more refined decision trees.
- CRT (Classification and Regression Trees): Splits data based on minimizing a variance-based measure like the Gini index or entropy.
- QUEST (Quick, Unbiased, Efficient Statistical Tree): A method designed for faster binary splits, reducing bias and computation time in decision tree building.
5. Difference / Other Types of Classify Analysis
- Two-step Cluster Analysis: Automatically determines the number of clusters, handles large datasets, and works with both continuous and categorical data.
- K-Means Cluster Analysis: A partitioning method that requires the user to specify the number of clusters in advance. It is suitable for continuous variables.
- Hierarchical Cluster Analysis: Produces a dendrogram showing nested clusters but is computationally intensive, especially for large datasets.
- Cluster Analysis Silhouette: Measures how similar each point is to its own cluster compared to other clusters, providing a graphical evaluation of the clustering quality.
- Decision Tree Analysis: A classification method that predicts the value of a target variable based on several input variables, commonly used for categorical outcomes.
- Discriminant Analysis: A classification method that finds the linear combination of features that best separate two or more classes.
- Nearest Neighbor Analysis: A classification algorithm that assigns each observation to the nearest cluster based on the distance metric.
6. What are the Assumptions of the Decision Tree Analysis?
- Sufficient sample size: A large enough dataset is needed for meaningful splits.
- Appropriate variables: Both categorical and continuous variables can be used, but the dependent variable should match the tree’s goal (classification or regression).
- No multicollinearity: Highly correlated predictors should be avoided, as they could distort the decision-making process.
7. What is the Hypothesis of the Decision Tree Analysis?
The hypothesis for Decision Tree Analysis relates to whether certain input variables (predictors) effectively classify or predict the target variable. For instance, if we use customer data, the hypothesis might test whether demographic features like age and income level are significant predictors of whether a customer will make a purchase.
The null hypothesis assumes no relationship between the predictors and the target variable, while the alternative hypothesis suggests that at least one of the predictors significantly affects the target outcome.
8. An Example of the Decision Tree Analysis
In this example, we will use Decision Tree Analysis to predict whether a patient is at risk of developing heart disease. The dataset includes variables such as Age, Gender, Daily Activity, Cholesterol Level (mg/dL), and Smoking Habits. These variables serve as predictors, while the target outcome is whether the patient has been diagnosed with heart disease.

Step by Step: Running Decision Tree Analysis in SPSS Statistics
Let’s embark on a step-by-step guide on performing the Decision Tree using SPSS
- STEP: Load Data into SPSS
Commence by launching SPSS and loading your dataset, which should encompass the variables of interest – a categorical independent variable. If your data is not already in SPSS format, you can import it by navigating to File > Open > Data and selecting your data file.
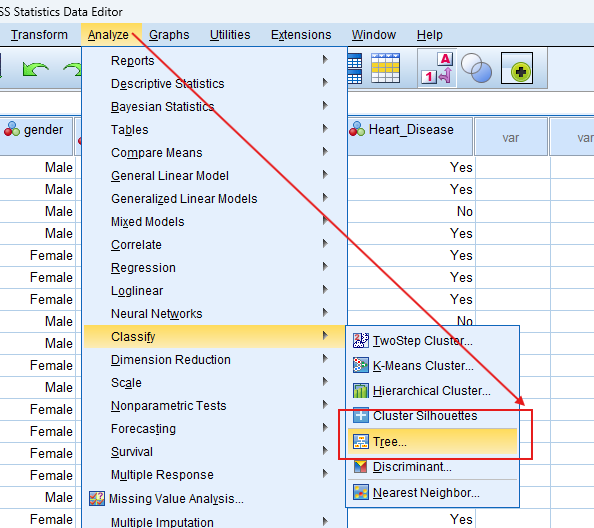
- STEP: Access the Analyze Menu
In the top menu, Go to Analyze > Classify > Tree.
- STEP: Specify Variables
- Choose the Tree Growing Method: Select CHAID, CRT, QUEST, or Exhaustive CHAID, depending on your data and analysis needs.
- STEP: Generate SPSS Output
- Click ‘OK’ after selecting your variables and method. SPSS will run the analysis and generate output tables and survival curves.
Note: Conducting Decision Tree Analysis in SPSS provides a robust foundation for understanding the key features of your data. Always ensure that you consult the documentation corresponding to your SPSS version, as steps might slightly differ based on the software version in use. This guide is tailored for SPSS version 25, and for any variations, it’s recommended to refer to the software’s documentation for accurate and updated instructions.
SPSS Output for Decision Tree Analysis
11. How to Interpret SPSS Output of Decision Tree Analysis
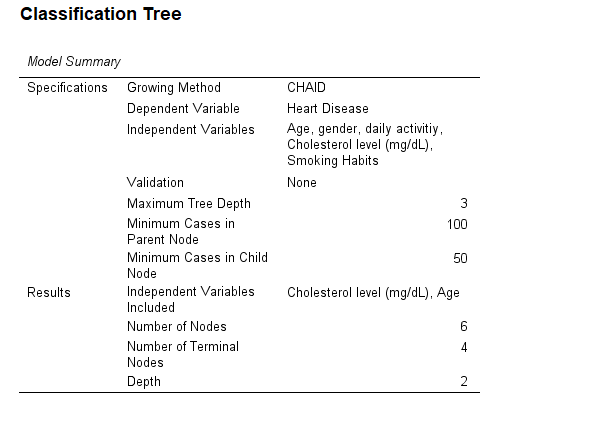
SPSS will generate output, including Model Summary, Tree Diagram, Gains for Node, Risk, and Classification
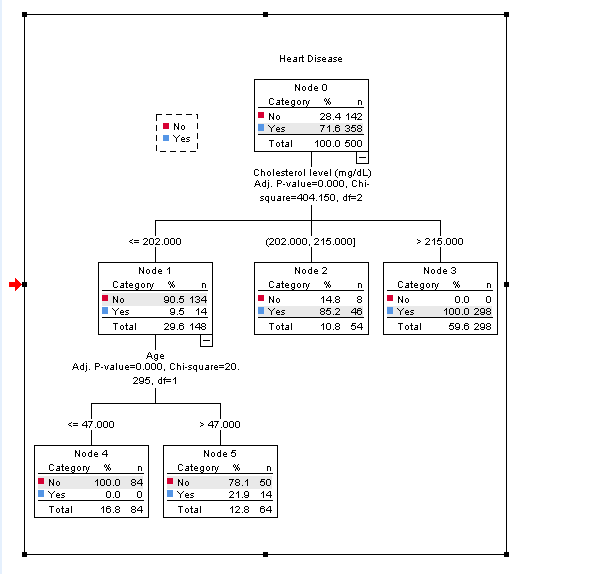
- Tree Diagram: The visual representation of the decision tree, showing how the data splits at each node.
- Node Summary: Information about each node, including the number of cases classified into each category.
- Variable Importance Chart: Highlights the variables most important in predicting the outcome.
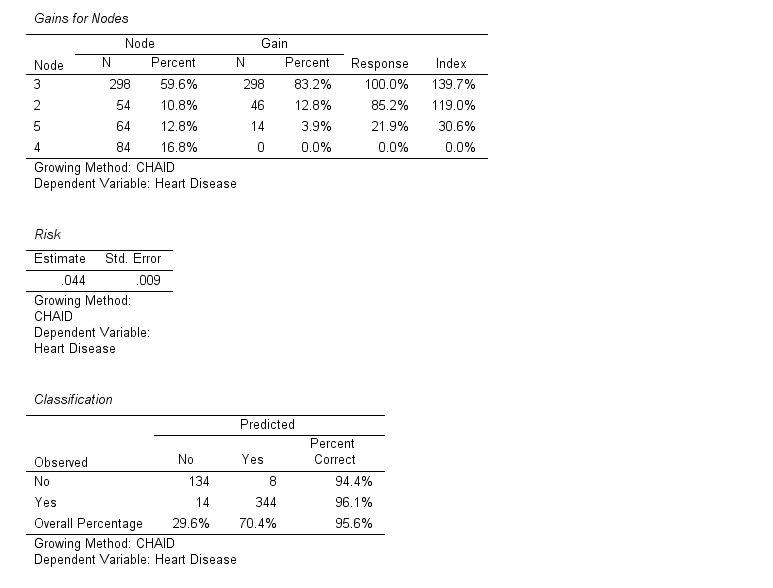
- Risk Estimate: Provides information on model accuracy, including misclassification rates.
12. How to Report Results of Decision Tree Analysis in APA
Reporting the results of Decision Tree Analysis in APA (American Psychological Association) format requires a structured presentation. Here’s a step-by-step guide in list format:
- Introduction: Briefly describe the purpose of the analysis and the theoretical background.
- Method: Detail the data collection process, variables used, and the model specified.
- Results: Present the parameter estimates with their standard errors, and significance levels.
- Figures and Tables: Include relevant plots and tables, ensuring they are properly labelled and referenced.
- Discussion: Interpret the results, highlighting the significance of the findings and their implications.
- Conclusion: Summarise the main points and suggest potential areas for further research.

Get Support For Your SPSS Data Analysis
Embark on a seamless research journey with SPSSAnalysis.com, where our dedicated team provides expert data analysis assistance for students, academicians, and individuals. We ensure your research is elevated with precision. Explore our pages;
- Statistical Advisory Service (SAS)
- Statistics Consultancy Service (SCS)
- Academic Statistical Analysis
- Hire a Dissertation Statistician
- Clinical Research Data Analysis
- Medical Data Analysis Expert
- Biostatistics Consulting
- Hire an Independent Statistician
- Help With Statistics (For PhD, For Dissertation, For Thesis, for DNP Project)
- Statistical Analysis Help for Doctorate of Nursing Practice
- SPSS Data Analysis Help for DNP
- Data Analysis – SPSS Help for Students
- SPSS Help by Subjects Area: Psychology, Sociology, Nursing, Education, Medical, Healthcare, Epidemiology, Marketing
Connect with us at SPSSAnalysis.com to empower your research endeavors and achieve impactful data analysis results. Get a FREE Quote Today!