Silhouette Cluster Analysis
Discover Silhouette Cluster Analysis in SPSS! Learn how to perform, understand SPSS output, and report results in APA style. Check out this simple, easy-to-follow guide below for a quick read!
Struggling with the Silhouette Cluster Analysis in SPSS? We’re here to help. We offer comprehensive assistance to students, covering assignments, dissertations, research, and more. Request Quote Now!

1. Introduction
Silhouette cluster analysis evaluates the quality of clusters after performing a cluster analysis. It measures how well an object matches its own cluster compared to others. The silhouette score ranges from -1 to 1, with higher values showing that the object fits its own cluster well and differs from others. This method helps assess whether the clusters formed are valid and if the clustering solution is suitable.
In SPSS, researchers often combine the silhouette coefficient with clustering methods like K-Means or hierarchical clustering. This analysis provides valuable insights into cluster cohesion and separation, allowing researchers to validate data groupings. By calculating silhouette scores, they can confirm whether the correct number of clusters has been chosen and if the data points are grouped meaningfully.
2. What is the Silhouette Cluster Analysis in Statistics?
Silhouette cluster analysis evaluates how well an object fits within its assigned cluster compared to other clusters. It provides a graphical representation of the silhouette score for each data point, allowing researchers to assess the quality of the clusters. The silhouette takes into account both the cohesion (how close the object is to others in the same cluster) and separation (how far it is from the nearest neighboring cluster).
The silhouette score is calculated by comparing the average distance between a point and all other points in the same cluster (a) with the average distance between that point and all points in the nearest neighboring cluster (b).
The score (s) is given by the formula: s = (b – a) / max(a, b).
A positive silhouette score indicates that the object is well-clustered, while a negative score suggests that it might belong to a different cluster.
3. What is the Silhouette Cluster Analysis Used For?
Silhouette cluster analysis plays a key role in validating the outcomes of clustering algorithms, helping researchers confirm whether the selected number of clusters is appropriate. It ensures that the formed clusters are cohesive and distinct. A high silhouette score shows that data points within each cluster are closely related, and the clusters are clearly separated from one another.
This method becomes particularly valuable when researchers need to compare different clustering solutions or techniques. For example, after performing K-Means and hierarchical clustering, silhouette analysis helps identify which method yields better clustering quality. It also aids in determining the optimal number of clusters by highlighting where the highest silhouette scores are achieved.
4. Some Definitions: Dissimilarity Measure:
-
- Euclidean Distance: Measures the straight-line distance between two points. It is the most common metric used in clustering algorithms.
- Absolute Difference: Calculates the absolute difference between points, often used when the direction of the relationship does not matter.
- Minkowski Distance: A generalized distance measure that includes both Euclidean and Manhattan distances depending on the parameter chosen.
- Gower’s Distance: A metric for mixed types of data, combining continuous and categorical variables in distance calculations.
- Maximum Distance (Chebyshev): Uses the maximum absolute difference between two data points to compute distance. It emphasizes large differences.
5. Difference / Other Types of Classify
Cluster analysis comes in various forms, each serving different research needs and data structures. Here’s a quick comparison:
- Two-step Cluster Analysis: Automatically determines the number of clusters, handles large datasets, and works with both continuous and categorical data.
- K-Means Cluster Analysis: A partitioning method that requires the user to specify the number of clusters in advance. It is suitable for continuous variables.
- Hierarchical Cluster Analysis: Produces a dendrogram showing nested clusters but is computationally intensive, especially for large datasets.
- Cluster Analysis Silhouette: Measures how similar each point is to its own cluster compared to other clusters, providing a graphical evaluation of the clustering quality.
- Decision Tree Analysis: A classification method that predicts the value of a target variable based on several input variables, commonly used for categorical outcomes.
- Discriminant Analysis: A classification method that finds the linear combination of features that best separate two or more classes.
- Nearest Neighbor Analysis: A classification algorithm that assigns each observation to the nearest cluster based on the distance metric.
6. What are the Assumptions of the Silhouette Cluster Analysis?
Silhouette cluster analysis requires that several key assumptions are met to provide meaningful results. These assumptions guide the application of the technique to different types of data and ensure that clusters formed are valid representations of the data’s structure.
Here are the key assumptions:
- We assume that Clusters are distinct and non-overlapping.
- The dissimilarity measure chosen (e.g., Euclidean distance) should be appropriate for the data type.
- We assume that data points within clusters is more similar to each other than to points in other clusters.
- The clustering solution (e.g., from K-Means or hierarchical clustering) should have been performed correctly, with appropriate preprocessing.
- No significant outliers that could distort clustering results.
7. What is the Hypothesis of the Silhouette Cluster Analysis?
- Null Hypothesis (H₀): The clustering solution does not produce well-separated clusters, and the silhouette score is low or negative.
- Alternative Hypothesis (H₁): The clustering solution produces well-separated clusters, with a high silhouette score indicating that the clusters are valid.
8. An Example of the Silhouette Cluster Analysis
PS: Cluster Number of Case: We obtained this variable from a previous K-Means Cluster Analysis Example, where we identified how customers are naturally grouped based on the abovementioned variables.
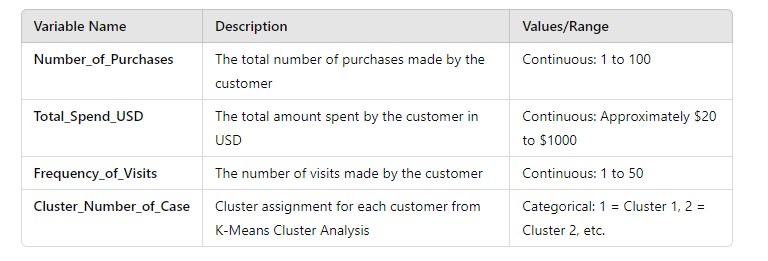
Example of Silhouette Cluster Analysis in SPSS – Codebook for the Dataset
Step by Step: Running Silhouette Cluster Analysis in SPSS Statistics
Let’s embark on a step-by-step guide on performing the Silhouette Cluster Analysis using SPSS
- STEP: Load Data into SPSS
Commence by launching SPSS and loading your dataset, which should encompass the variables of interest – a categorical independent variable. If your data is not already in SPSS format, you can import it by navigating to File > Open > Data and selecting your data file.
- STEP: Access the Analyze Menu
- First, perform a K-Means Cluster Analysis to obtain cluster assignments:
- Go to
Analyze > Classify > K-Means Cluster. - Select the variables Number of purchases, Total amount spent, and Frequency of visits as clustering variables.
- Specify the number of clusters you want to form (e.g., 2 or 3 clusters).
- Once the analysis is complete, SPSS will assign each case to a cluster, which will be used in the Silhouette Analysis.
- Go to
- Now, perform the Silhouette Cluster Analysis:
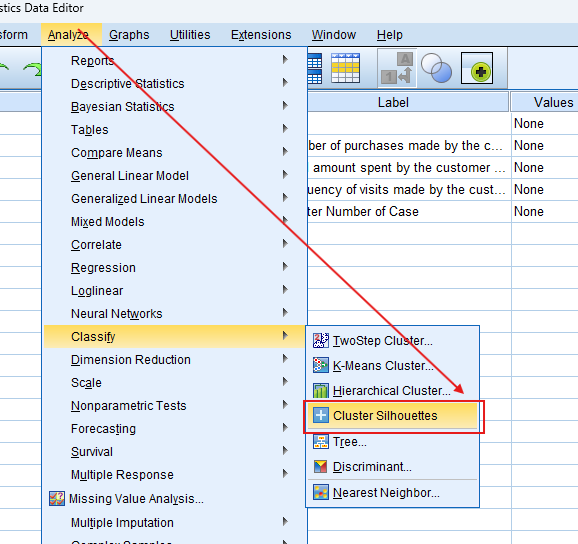
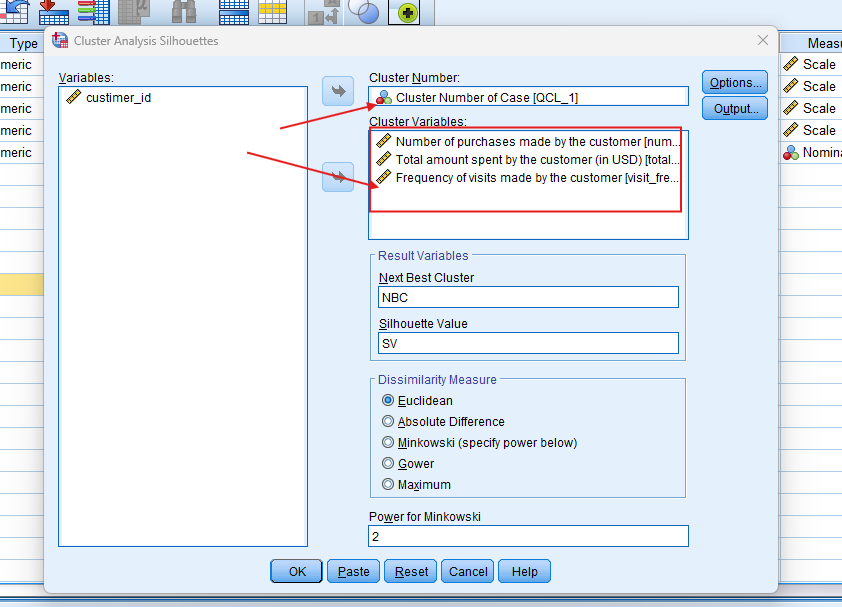
- Go to
Analyze > Classify > Cluster Silhouettes. - In the dialog box, specify the cluster number (e.g., 2 or 3) and move the variables (Number of purchases, Total amount spent, and Frequency of visits) into the Cluster Variables box.
- Select a dissimilarity measure, such as Euclidean distance.
- Run the analysis to obtain the silhouette values, which will indicate how well each case fits into its assigned cluster.
- Go to
3. STEP: Generate SPSS Output
- Click ‘OK’ after selecting your variables and method. SPSS will run the analysis and generate output tables and survival curves.
Note: Conducting Silhouette Cluster Analysis in SPSS provides a robust foundation for understanding the key features of your data. Always ensure that you consult the documentation corresponding to your SPSS version, as steps might slightly differ based on the software version in use. This guide is tailored for SPSS version 25, and for any variations, it’s recommended to refer to the software’s documentation for accurate and updated instructions.
SPSS Output for Silhouette Cluster Analysis
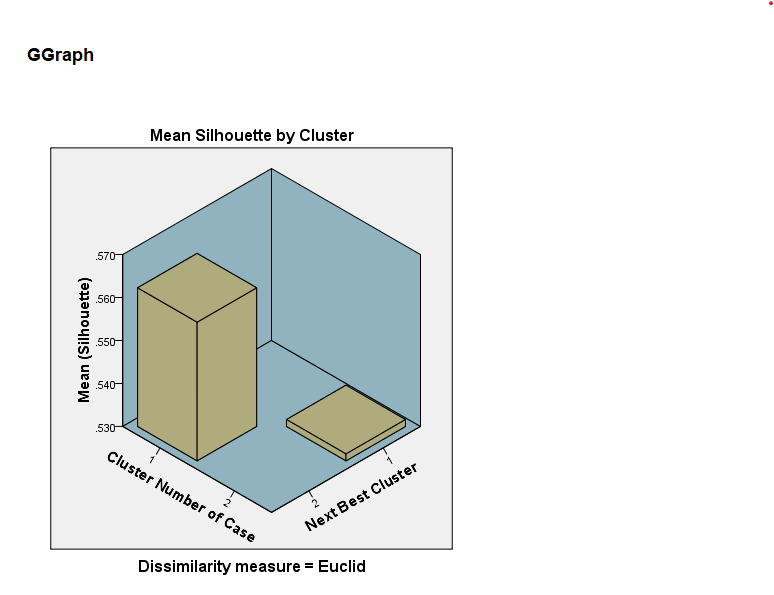
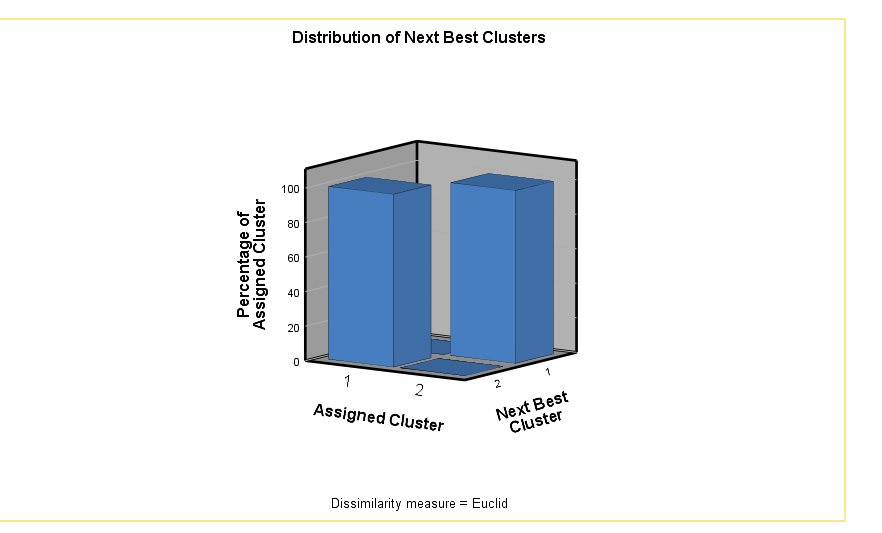
11. How to Interpret SPSS Output of Silhouette Cluster Analysis
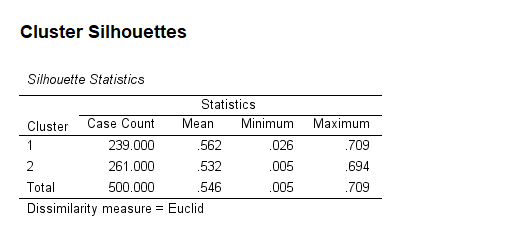
SPSS will generate output, including Sillhouttle Statistics, Mean Silhouette by Cluster, and Distribution of Next Best Clusters
- Silhouette Score: Provides an overall measure of cluster cohesion and separation. Higher scores (>0.5) suggest well-formed clusters
- Silhouette Plot: Displays the silhouette score for each data point. A well-clustered data point will have a silhouette score close to 1, while a score close to -1 indicates a point that may belong to another cluster.
- Cluster Quality: Look at the average silhouette score to evaluate how well-separated the clusters are.
12. How to Report Results of Silhouette Cluster Analysis in APA
Reporting the results of Silhouette Cluster Analysis in APA (American Psychological Association) format requires a structured presentation. Here’s a step-by-step guide in list format:
- Introduction: Briefly describe the purpose of the analysis and the theoretical background.
- Method: Detail the data collection process, variables used, and the model specified.
- Results: Present the parameter estimates with their standard errors, and significance levels.
- Figures and Tables: Include relevant plots and tables, ensuring they are properly labelled and referenced.
- Discussion: Interpret the results, highlighting the significance of the findings and their implications.
- Conclusion: Summarise the main points and suggest potential areas for further research.

Get Support For Your SPSS Data Analysis
Embark on a seamless research journey with SPSSAnalysis.com, where our dedicated team provides expert data analysis assistance for students, academicians, and individuals. We ensure your research is elevated with precision. Explore our pages;
- Statistical Advisory Service (SAS)
- Statistics Consultancy Service (SCS)
- Academic Statistical Analysis
- Hire a Dissertation Statistician
- Clinical Research Data Analysis
- Medical Data Analysis Expert
- Biostatistics Consulting
- Hire an Independent Statistician
- Help With Statistics (For PhD, For Dissertation, For Thesis, for DNP Project)
- Statistical Analysis Help for Doctorate of Nursing Practice
- SPSS Data Analysis Help for DNP
- Data Analysis – SPSS Help for Students
- SPSS Help by Subjects Area: Psychology, Sociology, Nursing, Education, Medical, Healthcare, Epidemiology, Marketing
Connect with us at SPSSAnalysis.com to empower your research endeavors and achieve impactful data analysis results. Get a FREE Quote Today!