Nearest Neighbour Analysis
Discover Nearest Neighbour Analysis in SPSS! Learn how to perform, understand SPSS output, and report results in APA style. Check out this simple, easy-to-follow guide below for a quick read!
Struggling with the Nearest Neighbour Analysis in SPSS? We’re here to help. We offer comprehensive assistance to students, covering assignments, dissertations, research, and more. Request Quote Now!

1. Introduction
Nearest Neighbour Analysis in SPSS is a statistical technique used for classification and pattern recognition. It works by comparing each observation in a dataset to its closest neighbours, based on selected criteria. Researchers use this method to categorise observations into predefined groups. It is commonly applied in areas like machine learning, market segmentation, and predictive analytics.
In SPSS, performing Nearest Neighbour Analysis allows researchers to handle complex datasets where group memberships are not clearly defined. This post will explain what Nearest Neighbour Analysis is, its uses, and how to perform it in SPSS. We’ll also cover the key assumptions, hypothesis, and the steps required to report the results following APA guidelines.
2. What is Nearest Neighbour Analysis in Statistics?
Nearest Neighbour Analysis is a classification technique that relies on proximity. For each data point, the algorithm finds its nearest neighbour, based on a specified distance metric, such as Euclidean distance. This distance helps determine how similar or dissimilar two data points are. The method assumes that observations in close proximity share similar characteristics.
By comparing each observation with its nearest neighbour, this method helps assign group membership. It is a non-parametric method, meaning it does not rely on any assumptions about the distribution of the data. This flexibility makes Nearest Neighbour Analysis suitable for various types of data in both social sciences and business research.
3. What is Nearest Neighbour Analysis used for?
Nearest Neighbour Analysis is widely used for classification tasks. In marketing, for instance, it helps segment customers based on their purchasing patterns by grouping them with their nearest neighbours. This allows companies to develop targeted marketing strategies. Similarly, in healthcare, it is used to predict whether a patient will develop a certain condition based on proximity to similar patient profiles.
Additionally, Nearest Neighbour Analysis is a key technique in pattern recognition, where the goal is to classify objects based on their proximity to known categories. In predictive modelling, it enables the classification of new data points based on their similarity to already labelled data, making it useful for tasks like fraud detection and customer retention.
4. Difference / Other Types of Classification Analysis
- Two-step Cluster Analysis: Automatically determines the number of clusters, handles large datasets, and works with both continuous and categorical data.
- K-Means Cluster Analysis: A partitioning method that requires the user to specify the number of clusters in advance. It is suitable for continuous variables.
- Hierarchical Cluster Analysis: Produces a dendrogram showing nested clusters but is computationally intensive, especially for large datasets.
- Cluster Analysis Silhouette: Measures how similar each point is to its own cluster compared to other clusters, providing a graphical evaluation of the clustering quality.
- Decision Tree Analysis: A classification method that predicts the value of a target variable based on several input variables, commonly used for categorical outcomes.
- Discriminant Analysis: A classification method that finds the linear combination of features that best separate two or more classes.
- Nearest Neighbor Analysis: A classification algorithm that assigns each observation to the nearest cluster based on the distance metric.
5. What are the Assumptions of Nearest Neighbour Analysis?
- The data points must be numeric to calculate the distance between them.
- The classification is based on proximity, requiring a meaningful distance metric (e.g., Euclidean distance).
- The data should not contain too much noise, as outliers may distort the results.
- The method assumes that observations close to each other in the feature space belong to the same group.
- The number of neighbours (k) should be carefully chosen to avoid overfitting or underfitting.
6. What is the Hypothesis of Nearest Neighbour Analysis?
- The null hypothesis states that group membership does not differ between observations based on their nearest neighbour.
- The alternative hypothesis suggests that group membership can be predicted by the proximity of observations to their nearest neighbours.
Observations close to each other are more likely to belong to the same group. The analysis improves classification accuracy by using proximity as a predictor.
7. An Example of Nearest Neighbour Analysis
Imagine a retail company that wants to predict which customers are likely to make repeat purchases. They collect data on customer demographics, purchase history, and browsing behaviour. By performing a Nearest Neighbour Analysis, the company can classify customers based on their similarity to previous buyers who made repeat purchases. Customers with similar profiles can be grouped together to predict their likelihood of returning.
In SPSS, this process involves selecting the relevant variables, defining the number of neighbours, and running the analysis. The output will provide the classification results, showing how well the model predicts customer behaviour based on proximity to similar cases. This method helps the company develop personalised marketing strategies to retain high-value customers.


Step by Step: Running Nearest Neighbour Analysis in SPSS Statistics
Let’s embark on a step-by-step guide on performing the Nearest Neighbour Analysis using SPSS
- STEP: Load Data into SPSS
Commence by launching SPSS and loading your dataset, which should encompass the variables of interest – a categorical independent variable. If your data is not already in SPSS format, you can import it by navigating to File > Open > Data and selecting your data file.
- STEP: Access the Analyze Menu
In the top menu, Go to Analyze > Classify > Nearest Neighbour.
- STEP: Specify Variables
- Select your dependent variable and the predictors you want to use for the analysis.
- Choose the number of nearest neighbours (k) you want to consider.
- Specify the distance metric, such as Euclidean or Manhattan distance
- STEP: Generate SPSS Output
- Click ‘OK’ after selecting your variables and method. SPSS will run the analysis and generate output tables and survival curves.
Note: Conducting Nearest Neighbour Analysis in SPSS provides a robust foundation for understanding the key features of your data. Always ensure that you consult the documentation corresponding to your SPSS version, as steps might slightly differ based on the software version in use. This guide is tailored for SPSS version 25, and for any variations, it’s recommended to refer to the software’s documentation for accurate and updated instructions.
SPSS Output for Nearest Neighbour Analysis
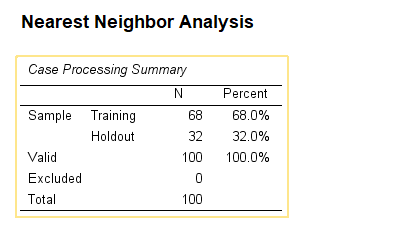

9. How to Interpret SPSS Output of Nearest Neighbour
SPSS will generate output, including 3D Plot and Case Summary Results
- Classification Table: This shows how well the model classifies observations into their correct groups.
- Accuracy Rate: Provides the percentage of correctly classified cases.
- Confusion Matrix: Shows the actual versus predicted group membership for each observation.
- Distance Metric: Indicates the distance used to classify each case, helping to understand how proximity affects classification.
- k-value: The number of nearest neighbours considered in the analysis, which affects the model’s performance.
10. How to Report Results of Nearest Neighbour Analysis in APA
Reporting the results of Nearest Neighbour Analysis in APA (American Psychological Association) format requires a structured presentation. Here’s a step-by-step guide in list format:
- Introduction: Briefly describe the purpose of the analysis and the theoretical background.
- Method: Detail the data collection process, variables used, and the model specified.
- Results: Present the parameter estimates with their standard errors, and significance levels.
- Figures and Tables: Include relevant plots and tables, ensuring they are properly labelled and referenced.
- Discussion: Interpret the results, highlighting the significance of the findings and their implications.
- Conclusion: Summarise the main points and suggest potential areas for further research.

Get Support For Your SPSS Data Analysis
Embark on a seamless research journey with SPSSAnalysis.com, where our dedicated team provides expert data analysis assistance for students, academicians, and individuals. We ensure your research is elevated with precision. Explore our pages;
- Statistical Advisory Service (SAS)
- Statistics Consultancy Service (SCS)
- Academic Statistical Analysis
- Hire a Dissertation Statistician
- Clinical Research Data Analysis
- Medical Data Analysis Expert
- Biostatistics Consulting
- Hire an Independent Statistician
- Help With Statistics (For PhD, For Dissertation, For Thesis, for DNP Project)
- Statistical Analysis Help for Doctorate of Nursing Practice
- SPSS Data Analysis Help for DNP
- Data Analysis – SPSS Help for Students
- SPSS Help by Subjects Area: Psychology, Sociology, Nursing, Education, Medical, Healthcare, Epidemiology, Marketing
Connect with us at SPSSAnalysis.com to empower your research endeavors and achieve impactful data analysis results. Get a FREE Quote Today!