K-Means Cluster Analysis
Discover the K-Means Cluster Analysis in SPSS! Learn how to perform, understand SPSS output, and report results in APA style. Check out this simple, easy-to-follow guide below for a quick read!
Struggling with the K-Means Cluster Analysis in SPSS? We’re here to help. We offer comprehensive assistance to students, covering assignments, dissertations, research, and more. Request Quote Now!
1. Introduction
K-means cluster analysis is one of the most widely used clustering techniques in statistics. This method groups observations into clusters based on the similarity of their features, aiming to minimize the variability within each cluster and maximize the differences between clusters. Each cluster is represented by its centroid, and observations are assigned to the cluster with the nearest centroid based on a distance measure, such as Euclidean distance.
In SPSS, K-means cluster analysis provides a simple, efficient way to group data into a predefined number of clusters. Unlike hierarchical clustering, K-means clustering requires the researcher to specify the number of clusters beforehand, making it suitable for large datasets where the number of natural clusters is known or hypothesized.
2. What is K-Means Cluster Analysis in Statistics?
K-means cluster analysis is an iterative, unsupervised learning algorithm used to partition a dataset into a predefined number of clusters (k). The algorithm assigns each data point to the nearest cluster based on a distance metric, usually Euclidean distance. The goal of K-means is to minimize the sum of squared distances between data points and their respective cluster centroids.
K-means is a centroid-based algorithm that works iteratively to adjust the centroids and reassign data points until no further changes occur or a predefined convergence criterion is met. This method is popular for its simplicity, scalability, and effectiveness in creating clusters with similar characteristics.
3. What is the K-Means Cluster Analysis Used For?
K-means cluster analysis is commonly used in various fields such as marketing, biology, and social sciences. It is especially helpful in market segmentation, where companies use it to group customers with similar behaviors or preferences. By identifying customer segments, businesses can develop targeted marketing strategies or product recommendations.
Beyond marketing, K-means clustering is applied to pattern recognition, image analysis, and bioinformatics. In these areas, K-means helps researchers identify clusters of similar items, such as gene expressions or consumer behavior patterns, facilitating further analysis and decision-making.
4. Method Definitions
- Iterate Classify: This option allows the algorithm to iteratively classify and reclassify data points until the centroids stabilize and no further reassignment of points is necessary.
- Only Classify: This method assigns data points to the nearest cluster without iterative reclassification, making it faster but less accurate.
5. Other Types of Cluster Analysis
Below, we briefly compare K-means cluster analysis with other types of cluster analysis in SPSS, including two-step cluster analysis, hierarchical clustering, and discriminant analysis. This comparison highlights their key features and ideal use cases.
- Two-step Cluster Analysis: Automatically determines the number of clusters, handles large datasets, and works with both continuous and categorical data.
- K-Means Cluster Analysis: A partitioning method that requires the user to specify the number of clusters in advance. It is suitable for continuous variables.
- Hierarchical Cluster Analysis: Produces a dendrogram showing nested clusters but is computationally intensive, especially for large datasets.
- Cluster Analysis Silhouette: Measures how similar each point is to its own cluster compared to other clusters, providing a graphical evaluation of the clustering quality.
- Decision Tree Analysis: A classification method that predicts the value of a target variable based on several input variables, commonly used for categorical outcomes.
- Discriminant Analysis: A classification method that finds the linear combination of features that best separate two or more classes.
- Nearest Neighbor Analysis: A classification algorithm that assigns each observation to the nearest cluster based on the distance metric.
6. What are the Assumptions of the K-Means Cluster Analysis?
Like all statistical techniques, the K-means cluster analysis requires some assumptions to ensure valid results. By meeting these assumptions, you can ensure that the clusters produced by the algorithm represent meaningful groupings.
- The number of clusters must be predefined.
- Data should be continuous or standardized if categorical variables are included.
- Clusters should be spherical, with similar variance across all clusters.
- Data should not contain significant outliers, as they can skew the results.
- The algorithm assumes that the distance between points is best represented using Euclidean distance.
7. What is the Hypothesis of the K-Means Cluster Analysis?
The K-means clustering method, although exploratory, operates under a specific hypothesis framework. Researchers use this method with the underlying assumption that meaningful groups or clusters exist within the dataset. By clustering data points based on their similarities, K-means aims to test whether the data naturally divides into these predefined groups.
- Null Hypothesis (H₀): There is no meaningful clustering within the data, and the observations belong to one large group.
- Alternative Hypothesis (H₁): There are distinct clusters within the data, and the observations can be grouped into meaningful clusters.
8. An Example of the K-Means Cluster Analysis
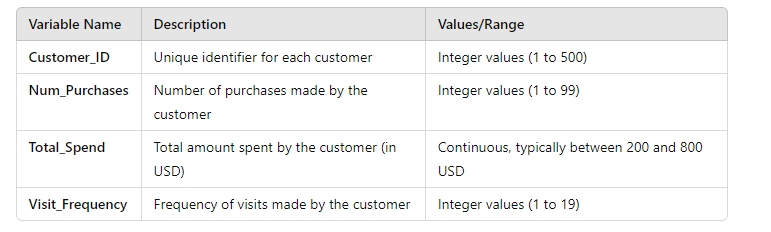
Let’s consider a marketing team that wants to segment customers based on their purchase behavior. The team collects data on the number of purchases, total spend, and frequency of visits. Using K-means clustering, they specify three clusters. The algorithm then groups customers into three distinct segments: low spenders, moderate spenders, and high spenders. The marketing team can now develop targeted campaigns for each group, such as offering discounts to low spenders or loyalty rewards to high spenders.
Step by Step: Running K-Means Cluster Analysis in SPSS Statistics
Let’s embark on a step-by-step guide on performing the K Means Cluster Analysis using SPSS
- STEP: Load Data into SPSS
Commence by launching SPSS and loading your dataset, which should encompass the variables of interest – a categorical independent variable. If your data is not already in SPSS format, you can import it by navigating to File > Open > Data and selecting your data file.
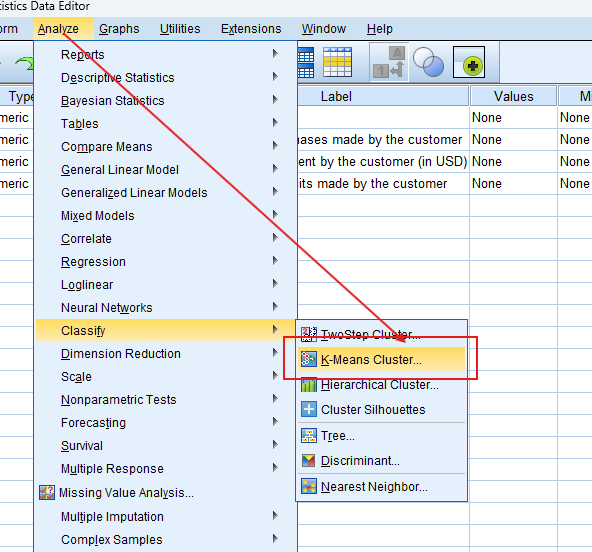
- STEP: Access the Analyze Menu
In the top menu, Go to Analyze > Classify > K-Means Cluster.
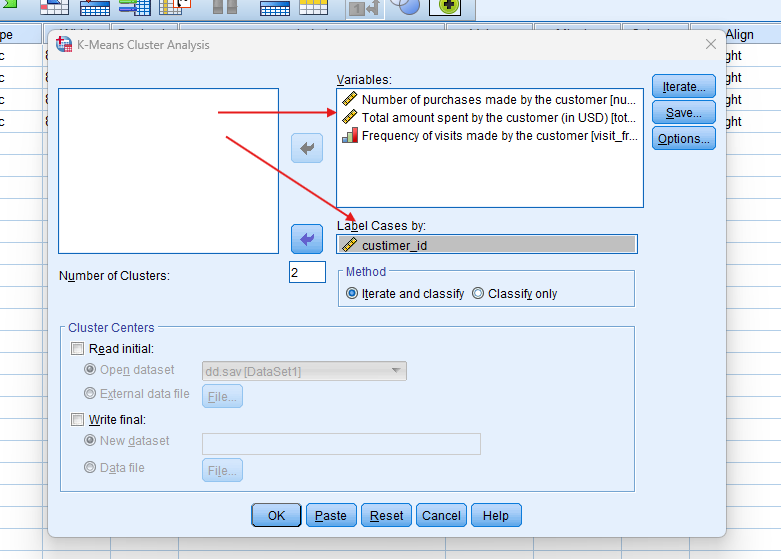
- STEP: Specify Variables
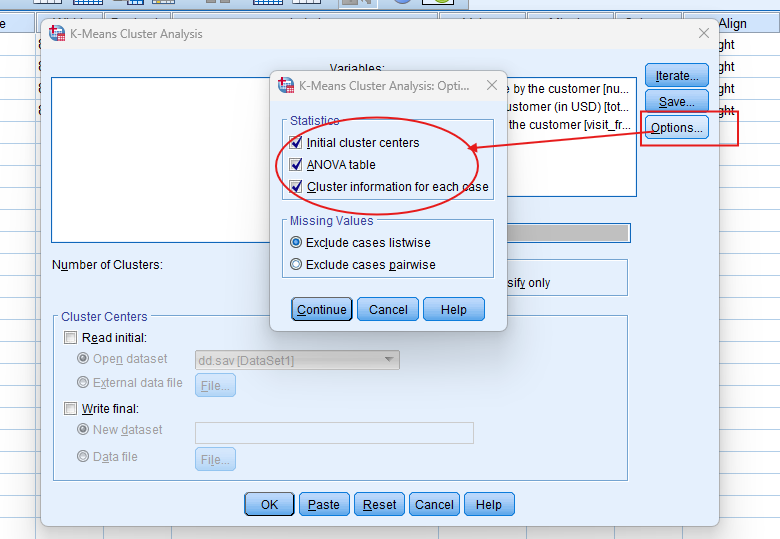
- Select your variables: Move continuous variables (e.g., number of purchases, total spend) into the analysis.
- In the “Number of Clusters” box, specify the number of clusters you want (e.g., 3).
- Under “Method”, choose either Iterate Classify for iterative reclassification or Only Classify for a one-time assignment.
- STEP: Generate SPSS Output
- Click ‘OK’ after selecting your variables and method. SPSS will run the analysis and generate output tables and survival curves.
Note: Conducting K-Means cluster Analysis in SPSS provides a robust foundation for understanding the key features of your data. Always ensure that you consult the documentation corresponding to your SPSS version, as steps might slightly differ based on the software version in use. This guide is tailored for SPSS version 25, and for any variations, it’s recommended to refer to the software’s documentation for accurate and updated instructions.
10. SPSS Output for TwoStep Cluster Analysis
11. How to Interpret SPSS Output of K-Means Cluster Analysis
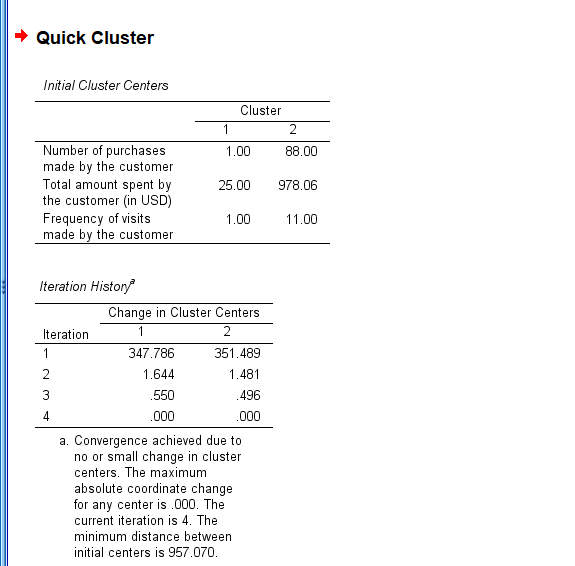
SPSS will generate output, including Initial Cluster Centers, Iteration History, Final Cluster Centers, Distance between Final Cluster Centers, ANOVA, and Number of cases in each cluster
- Iteration History: Shows how the cluster centroids shift during each iteration and when the algorithm converges.
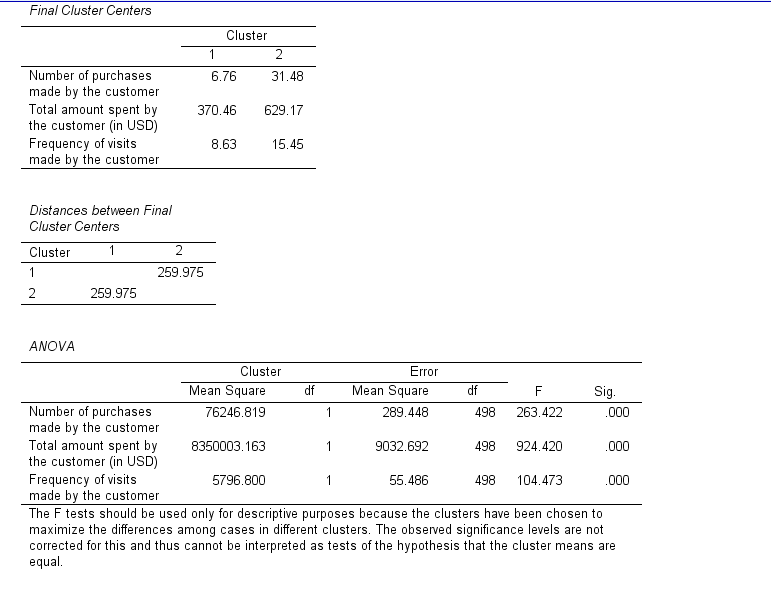
- Final Cluster Centers: Lists the centroid values for each variable in each cluster, which help describe the characteristics of each group.
- ANOVA Table: Indicates the variables that contribute most to differentiating between clusters based on F-values.
- Cluster Sizes: Provides the number of cases in each cluster, helping you understand how well-balanced the clusters are.
12. How to Report Results of K-Means Cluster Analysis in APA
Reporting the results of K-Means Cluster Analysis in APA (American Psychological Association) format requires a structured presentation. Here’s a step-by-step guide in list format:
- Introduction: Briefly describe the purpose of the analysis and the theoretical background.
- Method: Detail the data collection process, variables used, and the model specified.
- Results: Present the parameter estimates with their standard errors, and significance levels.
- Figures and Tables: Include relevant plots and tables, ensuring they are properly labelled and referenced.
- Discussion: Interpret the results, highlighting the significance of the findings and their implications.
- Conclusion: Summarise the main points and suggest potential areas for further research.
Get Support For Your SPSS Data Analysis
Embark on a seamless research journey with SPSSAnalysis.com, where our dedicated team provides expert data analysis assistance for students, academicians, and individuals. We ensure your research is elevated with precision. Explore our pages;
- Statistical Advisory Service (SAS)
- Statistics Consultancy Service (SCS)
- Academic Statistical Analysis
- Hire a Dissertation Statistician
- Clinical Research Data Analysis
- Medical Data Analysis Expert
- Biostatistics Consulting
- Hire an Independent Statistician
- Help With Statistics (For PhD, For Dissertation, For Thesis, for DNP Project)
- Statistical Analysis Help for Doctorate of Nursing Practice
- SPSS Data Analysis Help for DNP
- Data Analysis – SPSS Help for Students
- SPSS Help by Subjects Area: Psychology, Sociology, Nursing, Education, Medical, Healthcare, Epidemiology, Marketing
Connect with us at SPSSAnalysis.com to empower your research endeavors and achieve impactful data analysis results. Get a FREE Quote Today!