Hierarchical Cluster Analysis

Discover the Hierarchical Cluster Analysis in SPSS! Learn how to perform, understand SPSS output, and report results in APA style. Check out this simple, easy-to-follow guide below for a quick read!

Struggling with the Hierarchical Cluster Analysis in SPSS? We’re here to help. We offer comprehensive assistance to students, covering assignments, dissertations, research, and more. Request Quote Now!

1. Introduction

Hierarchical cluster analysis is a statistical technique used to group similar objects or cases based on their characteristics. Unlike K-means clustering, which requires the number of clusters to be specified in advance, hierarchical clustering produces a hierarchy or tree-like structure called a dendrogram, allowing researchers to determine the most appropriate number of clusters by visually inspecting the output. This technique is often used when the researcher does not have prior knowledge of how many clusters exist in the data.

In SPSS, hierarchical cluster analysis offers a flexible approach for exploring data structure by gradually merging similar objects into larger groups or splitting large clusters into smaller ones. It is especially useful for small to medium-sized datasets and works with both continuous and categorical variables, providing a visual representation of the relationships among cases.


2. What is the Hierarchical Cluster Analysis in Statistics?

Hierarchical cluster analysis is a method for identifying groups or clusters within a dataset without predefining the number of clusters. This approach works by either aggregating objects from smaller clusters into larger ones (agglomerative method) or dividing a large cluster into smaller clusters (divisive method). The algorithm measures the similarity between objects using various distance measures, such as Euclidean distance, and groups them into clusters based on their proximity.

The result of a hierarchical cluster analysis is typically represented as a dendrogram, which shows the arrangement of the clusters in a tree-like structure. Researchers can choose where to cut the tree to form the desired number of clusters. This method is often preferred when there is no clear expectation of how many clusters exist in the data.


3. What is the Hierarchical Cluster Analysis Used For?

Hierarchical cluster analysis is widely used in various fields, including marketing, biology, and psychology. In marketing, businesses use this method to group customers based on purchasing behavior, allowing them to develop targeted marketing strategies. In biology, researchers use hierarchical clustering to group organisms or genes based on their traits or genetic sequences. The flexibility of the method makes it useful for a broad range of applications where grouping similar cases or objects is essential.

Hierarchical clustering is also valuable in exploratory research, helping researchers uncover natural groupings in data without prior assumptions. It can be applied to both numerical and categorical data, making it a versatile tool for discovering patterns and relationships across disciplines.


4. Some Definitions

  • Hierarchical Cluster Method:
    • Between-groups Linkage: Measures the distance between clusters as the distance between the centroids of each cluster.
    • Within-groups Linkage: Minimizes the variance within clusters by linking objects with minimal within-cluster distances.
    • Nearest Neighbor: Also called single linkage, this method links clusters by minimizing the distance between the closest points of each cluster.
    • Furthest Neighbor: Also called complete linkage, this method links clusters by maximizing the distance between the farthest points in each cluster.
    • Centroid Clustering: Uses the centroid (mean) of the clusters to measure distance between clusters.
    • Median Clustering: Similar to centroid clustering but uses the median of the clusters.
    • Wald’s Clustering: A hierarchical method that clusters cases based on minimum variance and squared Euclidean distance.
  • The measure of Hierarchical:
    • Euclidean Distance: A straight-line distance measure used to calculate the similarity between points.
    • Square Euclidean Distance: The square of the Euclidean distance, emphasizing larger differences.
    • Cosine: Measures similarity based on the cosine of the angle between vectors.
    • Pearson Correlation: Measures similarity based on the linear correlation between variables.
    • Chebychev: Measures the maximum absolute difference between points across all dimensions.
    • Block: Also known as Manhattan distance, calculates the sum of absolute differences between points.
    • Minkowski: A generalization of Euclidean distance with a customizable order of the metric.
    • Customized: Allows the researcher to define a specific distance metric.
  • Transform Measure:
    • Absolute Values: Transforms all values to positive, ignoring the direction of the relationship.
    • Change Sign: Adjusts the sign of the data to reverse the direction of the relationship.
    • Rescale to 0-1 Range: Normalizes the data to a scale between 0 and 1.

5. Difference / Other Types of Cluster Analysis

Cluster analysis encompasses several methods, each suited to different types of data and research objectives. Below is a brief overview of various clustering methods:

  • Two-step Cluster Analysis: Automatically determines the number of clusters, handles large datasets, and works with both continuous and categorical data.
  • K-Means Cluster Analysis: A partitioning method that requires the user to specify the number of clusters in advance. It is suitable for continuous variables.
  • Hierarchical Cluster Analysis: Produces a dendrogram showing nested clusters but is computationally intensive, especially for large datasets.
  • Cluster Analysis Silhouette: Measures how similar each point is to its own cluster compared to other clusters, providing a graphical evaluation of the clustering quality.
  • Decision Tree Analysis: A classification method that predicts the value of a target variable based on several input variables, commonly used for categorical outcomes.
  • Discriminant Analysis: A classification method that finds the linear combination of features that best separate two or more classes.
  • Nearest Neighbor Analysis: A classification algorithm that assigns each observation to the nearest cluster based on the distance metric.

6. What are the Assumptions of the Hierarchical Cluster Analysis?

Before conducting hierarchical cluster analysis, certain assumptions must be met to ensure that the analysis is valid. These assumptions concern the nature of the data and the relationships between objects within the dataset. By fulfilling these assumptions, you can trust that the clusters identified represent meaningful patterns.

Here are the key assumptions of hierarchical cluster analysis:

  • The data should contain no significant outliers that could distort the clustering process.
  • Objects in the data should be similar or comparable using the chosen distance metric.
  • The variables should be measured on an appropriate scale (interval, ratio, etc.).
  • The number of objects should be reasonably small, as hierarchical clustering can be computationally intensive for large datasets.
  • The clusters are assumed to be non-overlapping, with distinct groupings.

7. What is the Hypothesis of the Hierarchical Cluster Analysis?

In hierarchical cluster analysis, the hypothesis framework focuses on whether meaningful clusters exist within the data. The analysis assumes that the dataset can be divided into distinct groups based on the similarities and differences between the cases.

  • Null Hypothesis (H₀): There is no meaningful clustering in the data, and all cases belong to one homogenous group.
  • Alternative Hypothesis (H₁): There are distinct clusters within the data, and cases can be grouped into separate clusters based on their characteristics.

8. An Example of the Hierarchical Cluster Analysis

Imagine a psychological study aiming to group individuals based on their personality traits. The dataset includes various psychological scales that measure extraversion, conscientiousness, and neuroticism. A hierarchical cluster analysis is applied, and the dendrogram suggests the presence of three distinct personality clusters: high extraversion, moderate conscientiousness, and low neuroticism. Based on these clusters, psychologists can develop tailored interventions for each group.

Example of Hierarchical Cluster Analysis – SPSS Dataset

9. How to Perform Hierarchical Cluster Analysis in SPSS

Step by Step: Running Hierarchical Cluster Analysis in SPSS Statistics

Let’s embark on a step-by-step guide on performing the Hierarchical Cluster Analysis using SPSS

  1. STEP: Load Data into SPSS

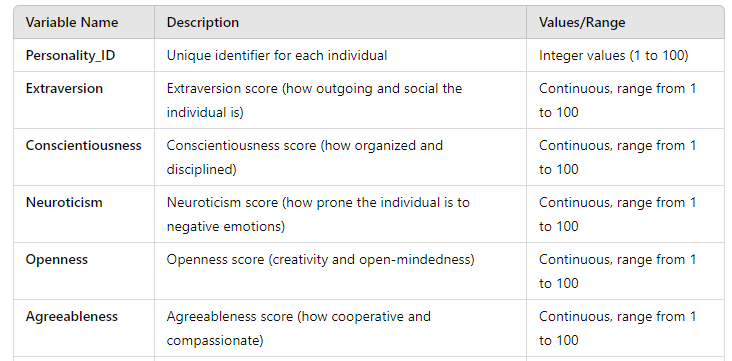
Commence by launching SPSS and loading your dataset, which should encompass the variables of interest – a categorical independent variable. If your data is not already in SPSS format, you can import it by navigating to File > Open > Data and selecting your data file.

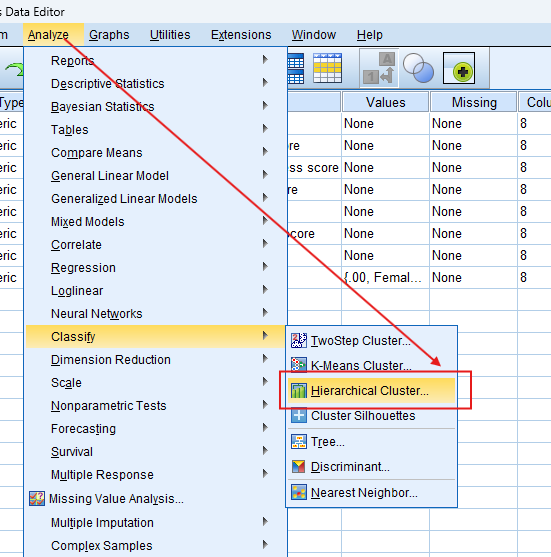
  1. STEP: Access the Analyze Menu

In the top menu, Go to Analyze > Classify >  Hierarchical Cluster.

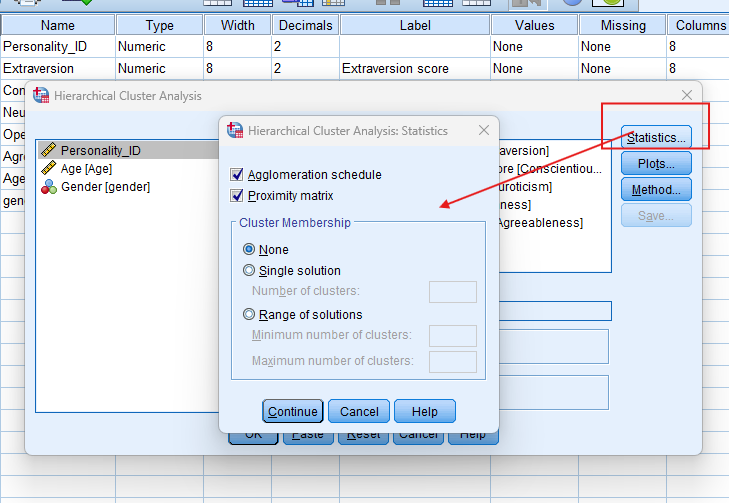
  1. STEP: Specify Variables 
  • Select your variables: Move continuous variables (e.g., personality traits) into the analysis.
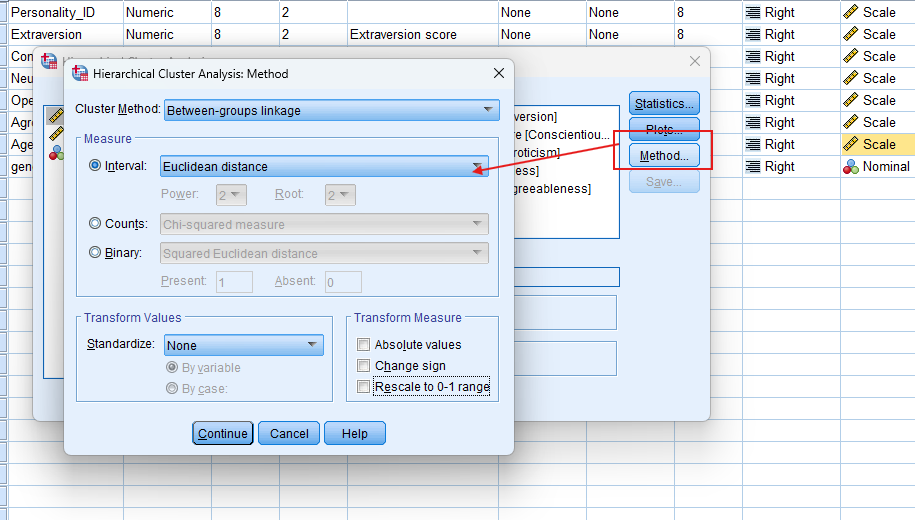
  • In the “Cluster Method” tab, select your preferred method, such as Between-groups Linkage or Nearest Neighbor.
  • In the “Measure” tab, choose a distance measure like Euclidean Distance or Pearson Correlation.
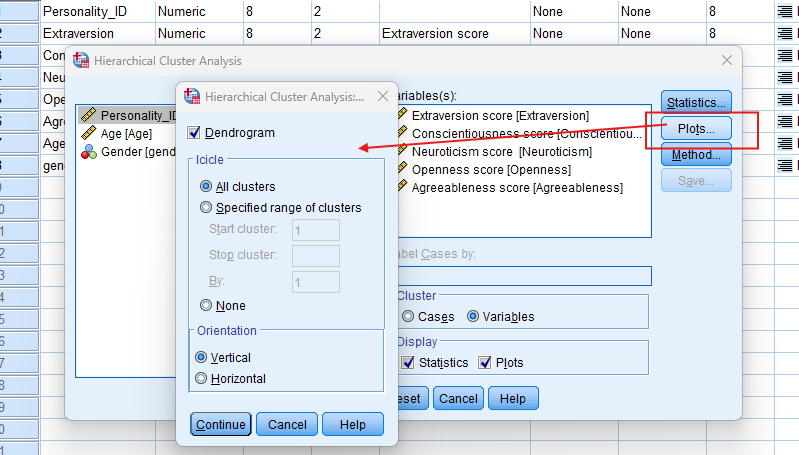
  1. STEP: Generate SPSS Output
  • Click ‘OK’ after selecting your variables and method. SPSS will run the analysis and generate output tables and survival curves.

Note: Conducting Hierarchical Cluster Analysis in SPSS provides a robust foundation for understanding the key features of your data. Always ensure that you consult the documentation corresponding to your SPSS version, as steps might slightly differ based on the software version in use. This guide is tailored for SPSS version 25, and for any variations, it’s recommended to refer to the software’s documentation for accurate and updated instructions.

10. SPSS Output for Hierarchical Cluster Analysis

11. How to Interpret SPSS Output of Hierarchical Cluster Analysis

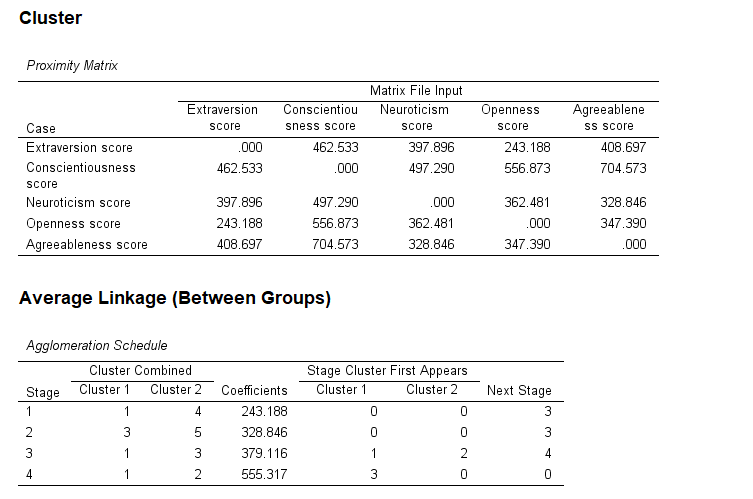
SPSS will generate output, including Case processing summary, proximity matrix, Agglomeration schedule, dendrogram plot

    • Dendrogram: Displays the hierarchy of clusters, showing how cases or variables merge step by step.
    • Agglomeration Schedule: Shows the distance or similarity at which clusters are merged.
    • Cluster Membership: Provides a list of cases and the cluster they belong to based on the selected cutoff point in the dendrogram.
    • Cluster Sizes: Lists the number of cases in each cluster to evaluate the balance between clusters.

12. How to Report Results of Hierarchical Cluster Analysis in APA

Reporting the results of Hierarchical Cluster Analysis in APA (American Psychological Association) format requires a structured presentation. Here’s a step-by-step guide in list format:

  • Introduction: Briefly describe the purpose of the analysis and the theoretical background.
  • Method: Detail the data collection process, variables used, and the model specified.
  • Results: Present the parameter estimates with their standard errors, and significance levels.
  • Figures and Tables: Include relevant plots and tables, ensuring they are properly labelled and referenced.
  • Discussion: Interpret the results, highlighting the significance of the findings and their implications.
  • Conclusion: Summarise the main points and suggest potential areas for further research.
Example of Hierarchical Cluster Analysis Results in APA Style

Get Support For Your SPSS Data Analysis

Embark on a seamless research journey with SPSSAnalysis.com, where our dedicated team provides expert data analysis assistance for students, academicians, and individuals. We ensure your research is elevated with precision. Explore our pages;

Connect with us at SPSSAnalysis.com to empower your research endeavors and achieve impactful data analysis results. Get a FREE Quote Today!

Do You Find Our Guide Helpful?

Your support helps us create more valuable Free Statistical Content and share knowledge with everyone. Every contribution matters!

Citation & Copyright Policy

Respect our work, cite properly, and support us if you use our content in your research or projects.

Struggling with Statistical Analysis in SPSS? - Hire a SPSS Helper Now!