Test of Marginal Homogeneity
Discover the Marginal Homogeneity Test in SPSS! Learn how to perform, understand SPSS output, and report results in APA style. Check out this simple, easy-to-follow guide below for a quick read!
Struggling with the Marginal Homogeneity Test in SPSS? We’re here to help. We offer comprehensive assistance to students, covering assignments, dissertations, research, and more. Request Quote Now!

1. Introduction
Understanding the nuances of various statistical tests can significantly enhance your data analysis skills. One such test, the Marginal Homogeneity Test in SPSS, plays a critical role in comparing paired categorical data. This blog post delves into the Marginal Homogeneity Test, explaining its purpose, applications, assumptions, and how to perform it in SPSS. By mastering this test, you can make more informed decisions based on your data, enhancing the quality and reliability of your research.
Firstly, we’ll explore the fundamentals of the Marginal Homogeneity Test in statistics. We’ll then examine its differences from similar tests like the Wilcoxon Signed Rank Test and McNemar’s Test. Next, we will look at its assumptions, hypotheses, and provide a step-by-step guide to performing it in SPSS. Finally, we’ll discuss how to interpret and report the results according to APA guidelines. Let’s begin this journey to deepen our understanding of this essential statistical tool.
2. The Marginal Homogeneity Test in Statistics?
The Marginal Homogeneity Test is a non-parametric test used in statistics to compare the distributions of two related samples. It specifically examines whether the marginal distributions of two categorical variables are identical. This test is particularly useful when dealing with paired samples, where each subject or entity in one sample corresponds to a unique subject or entity in the other sample.
Secondly, unlike other tests, the Marginal Homogeneity Test does not assume normal distribution of the data, making it versatile for various datasets. Researchers often employ this test when they need to assess changes in opinions or behaviours over time within the same group of subjects. By comparing the marginal distributions, the test provides valuable insights into whether significant changes have occurred.
3. What is the Marginal Homogeneity Test used for?
Researchers use the Marginal Homogeneity Test to evaluate whether there are significant differences between the marginal distributions of two related categorical variables. This test is crucial in longitudinal studies, where it is necessary to determine if changes over time within the same group are statistically significant. For instance, it helps in analysing pre-test and post-test data in educational research or assessing changes in consumer preferences.
Additionally, the Marginal Homogeneity Test is essential in medical studies for comparing diagnostic tests or treatment effects over time. It helps in determining if there are significant differences in the distribution of patients’ responses before and after a treatment or intervention. By applying this test, researchers can draw robust conclusions about the effectiveness of interventions or the consistency of diagnostic tests.
4. Marginal Homogeneity Test, Wilcoxon Signed Rank, and McNemar’s Test
They serve different purposes despite their similarities in comparing paired samples. The Marginal Homogeneity Test compares the marginal distributions of two categorical variables, focusing on whether their distributions remain the same over time or between conditions. This test is ideal for categorical data where the concern is with the overall distribution.
On the other hand, the Wilcoxon Signed Rank Test compares two related samples to assess whether their population mean ranks differ. It is suitable for ordinal data and is often used when the data do not meet the assumptions required for parametric tests. McNemar’s Test, similar to the Marginal Homogeneity Test, compares paired categorical data but focuses on binary outcomes. It assesses whether the proportions of two dichotomous variables are equal in a paired sample, often used in before-and-after studies in clinical research.
5. What Are Other Nonparametric Tests?
- Mann-Whitney U Test: Compares differences between two independent groups when the data are not normally distributed.
- Kruskal-Wallis Test: Extends the Mann-Whitney U Test to more than two groups, assessing rank differences—nonparametric alternative to One-Way ANOVA Test.
- Wilcoxon Signed-Rank Test: Compares two related samples or repeated measurements on a single sample to assess differences in their ranks.
- McNemar Test: Used for paired nominal data to determine changes in proportions.
- Friedman Test: Nonparametric alternative to repeated measures ANOVA, comparing ranks across multiple related groups.
- Sign Test: Evaluates the median of a single sample or compares medians of two related samples.
- Cochran’s Q Test: Extension of the McNemar test for more than two related groups.
- Kendall’s W: Assesses the agreement between raters.
- Binomial Test: Tests the observed proportion against a theoretical proportion.
- Jonckheere-Terpstra Test: Tests for ordered differences among groups.
- Wald-Wolfowitz Runs Test: Evaluates the randomness of a sequence.
- Median Test: Compares the medians of two or more groups.
6. The Assumptions of the Marginal Homogeneity Test
- The data must consist of paired samples.
- Each pair should be mutually exclusive.
- The test variables should be categorical.
- Observations should be independent within each pair.
- The sample size should be adequate to ensure the test’s validity.
7. The Hypothesis of the Marginal Homogeneity Test
Firstly, the null hypothesis (H0) of the Marginal Homogeneity Test states that the marginal distributions of the two related samples are identical. In other words, there is no significant difference between the paired categorical variables. This hypothesis implies that any observed differences are due to random chance rather than a systematic effect.
Secondly, the alternative hypothesis (H1) asserts that the marginal distributions of the two related samples are not identical. This means there is a significant difference between the distributions, suggesting a systematic change or effect. By testing these hypotheses, researchers can determine if the observed differences are statistically significant and draw meaningful conclusions from their data.
8. An Example of the Marginal Homogeneity Test
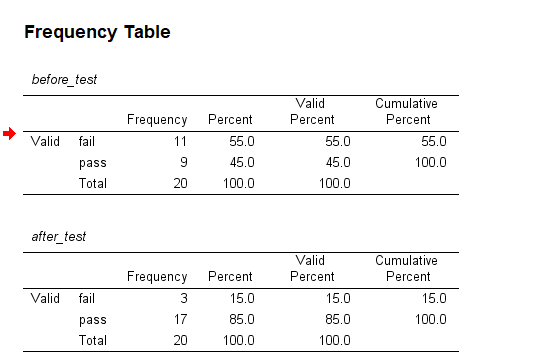
Consider a scenario in educational research where a teacher wants to assess the impact of a new teaching method on student performance. The teacher administers a test to the same group of students before and after implementing the new method. The test scores are categorised into ‘pass’ and ‘fail’ for simplicity. By applying the Marginal Homogeneity Test, the teacher can determine if the new teaching method significantly changed the pass and fail rates among the students.
Another example involves a medical study assessing the effect of a new medication on patient symptoms. Patients report their symptoms as ‘improved’, ‘unchanged’, or ‘worsened’ before and after the treatment. By using the Marginal Homogeneity Test, researchers can evaluate if the distribution of symptom categories has significantly shifted post-treatment, providing insights into the medication’s effectiveness.


Step by Step: Running the Marginal Homogeneity Test in SPSS Statistics
Let’s embark on a step-by-step guide on performing the Marginal Homogeneity Test using SPSS
- Input Data: Enter your repeated measures data into separate columns in SPSS.
- Select Test: Navigate to `Analyze` > `Nonparametric Tests` > `2 Related Samples`.
- Choose Variables: in the test dialogue box, move your paired variables into the ‘Test Variable List’ box.
- Run Test: Click `OK` to run the test.
- Review Output: SPSS will generate output tables with the test statistics and significance levels.
Note: Conducting the Marginal Homogeneity Test in SPSS provides a robust foundation for understanding the key features of your data. Always ensure that you consult the documentation corresponding to your SPSS version, as steps might slightly differ based on the software version in use. This guide is tailored for SPSS version 25, and for any variations, it’s recommended to refer to the software’s documentation for accurate and updated instructions.
10. SPSS Output for Mann-Whitney U Test
11. How to Interpret SPSS Output of Marginal Homogeneity Test
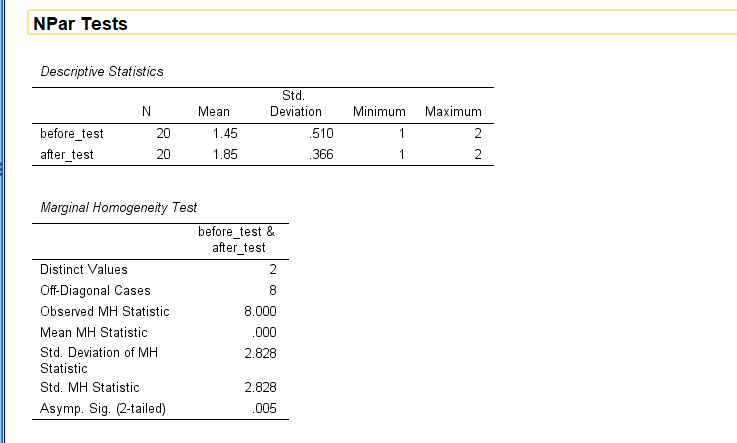
The SPSS output for the Marginal Homogeneity Test includes several tables, but the key table to focus on is the ‘Test Statistics’ table. This table provides the test statistic value and the associated p-value. If the p-value is less than the chosen significance level (typically 0.05), you reject the null hypothesis, indicating a significant difference between the marginal distributions.
Additionally, examine the ‘Crosstabulation’ table to understand the distribution of your paired categories. This table displays the frequency counts for each category combination, helping you interpret the nature and direction of the differences. By carefully analysing these tables, you can draw accurate conclusions about your data.
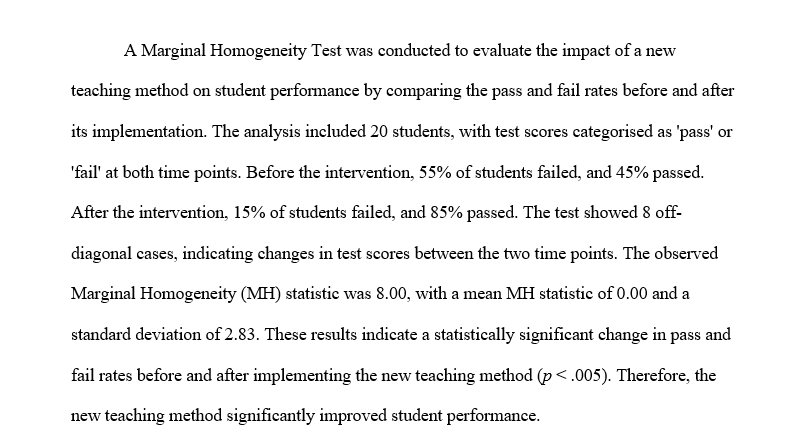
12. How to Report Results of the Marginal Homogeneity Test in APA
- State the purpose of the test and the variables compared.
- Report the test statistic value.
- Include the p-value to indicate statistical significance.
- Describe the direction and nature of the differences observed.
- Ensure all values are reported to the appropriate decimal places.
- Use APA formatting for tables and figures if applicable.
- Provide a concise interpretation of the results in the context of your study.
By following these steps, you can effectively report the results of the Marginal Homogeneity Test in accordance with APA guidelines, ensuring clarity and professionalism in your research presentation.
Get Help For Your SPSS Analysis
Embark on a seamless research journey with SPSSAnalysis.com, where our dedicated team provides expert data analysis assistance for students, academicians, and individuals. We ensure your research is elevated with precision. Explore our pages;
- SPSS Help by Subjects Area: Psychology, Sociology, Nursing, Education, Medical, Healthcare, Epidemiology, Marketing
- Dissertation Methodology Help
- Dissertation Data Analysis Help
- Dissertation Results Help
- Pay Someone to Do My Data Analysis
- Hire a Statistician for Dissertation
- Statistics Help for DNP Dissertation
- Pay Someone to Do My Dissertation Statistics
Connect with us at SPSSAnalysis.com to empower your research endeavors and achieve impactful data analysis results. Get a FREE Quote Today!