Median Test in SPSS
Discover the Median Test in SPSS! Learn how to perform, understand SPSS output, and report results in APA style. Check out this simple, easy-to-follow guide below for a quick read!
Struggling with the Median Test in SPSS? We’re here to help. We offer comprehensive assistance to students, covering assignments, dissertations, research, and more. Request Quote Now!

1. Introduction
The Median Test in SPSS stands as a robust tool for statistical analysis, particularly when dealing with non-parametric data. Unlike traditional parametric tests that assume a normal distribution, the Median Test allows researchers to make inferences about the central tendencies of different groups without such constraints. By focusing on medians, this test provides a valuable alternative for data that may not meet the assumptions required for parametric testing.
When using SPSS, conducting a Median Test becomes a streamlined process that enhances the reliability of your research findings. This guide aims to provide a comprehensive overview of the Median Test, including its purposes, assumptions, and step-by-step instructions for performing it in SPSS. Whether you are a novice or an experienced statistician, understanding the Median Test will bolster your analytical toolkit.
2. The Median Test in Statistics
In statistics, the Median Test is a non-parametric test that compares the medians of two or more groups. It evaluates whether there is a significant difference in the central tendency of the groups being compared. Unlike tests that compare means, the Median Test does not assume that the data follows a normal distribution, making it ideal for skewed or ordinal data.
The Median Test operates by classifying data points as above or below the overall median and then examining the frequency distribution across groups. By doing so, it provides a straightforward method to detect differences in the central location of data, which is particularly useful in fields like social sciences, medicine, and market research where non-parametric data is common.
3. What is the Median Test used for?
Researchers use the Median Test to determine if there are significant differences in the medians of different groups. This is particularly useful when the data does not meet the assumptions necessary for parametric tests, such as the t-test or ANOVA. The Median Test serves as an alternative method for comparing central tendencies without the need for normality in the data distribution.
In practical applications, the Median Test proves invaluable in various scenarios. For instance, it can be used to compare customer satisfaction levels across different service providers or to assess the effectiveness of different treatment methods in clinical trials. By focusing on medians, researchers can obtain meaningful insights from data that may otherwise be challenging to analyse using traditional parametric methods.
4. Kruskal-Wallis Test vs Median Test
Firstly, both the Kruskal-Wallis Test and the Median Test are non-parametric methods used to compare groups, but they differ in their approach. The Kruskal-Wallis Test ranks all data points and then compares the sum of ranks between groups. This test is often seen as an extension of the Mann-Whitney U test for more than two groups and provides a more detailed analysis of differences between distributions.
Secondly, the Median Test, on the other hand, simplifies the process by focusing solely on the median. It categorises data points as either above or below the overall median and then evaluates the distribution of these categories across groups. While the Kruskal-Wallis Test provides more detailed information, the Median Test offers a more straightforward and easy-to-interpret method for comparing central tendencies, especially when dealing with ordinal data or non-normally distributed data.
5. What Are Other Nonparametric Tests?
- Mann-Whitney U Test: Compares differences between two independent groups when the data are not normally distributed.
- Kruskal-Wallis Test: Extends the Mann-Whitney U Test to more than two groups, assessing rank differences—nonparametric alternative to One-Way ANOVA Test.
- Wilcoxon Signed-Rank Test: Compares two related samples or repeated measurements on a single sample to assess differences in their ranks.
- McNemar Test: Used for paired nominal data to determine changes in proportions.
- Friedman Test: Nonparametric alternative to repeated measures ANOVA, comparing ranks across multiple related groups.
- Sign Test: Evaluates the median of a single sample or compares medians of two related samples.
- Cochran’s Q Test: Extension of the McNemar test for more than two related groups.
- Kendall’s W: Assesses the agreement between raters.
- Binomial Test: Tests the observed proportion against a theoretical proportion.
- Jonckheere-Terpstra Test: Tests for ordered differences among groups.
- Wald-Wolfowitz Runs Test: Evaluates the randomness of a sequence.
- Marginal Homogeneity Test: Assesses changes in proportions in paired categorical data.
6. The Assumptions of the Median Test
- The data must be at least ordinal.
- The groups being compared should be independent.
- Each group should have a sufficiently large sample size to ensure reliable results.
- The test assumes that the medians of the groups are to be compared.
- There should be no tied ranks in the data, or ties should be minimal.
7. The Hypothesis of the Median Test
In the context of the Median Test, we define the null and alternative hypotheses as follows. The null hypothesis (H0) posits that the medians of the groups are equal. Essentially, it suggests that there is no significant difference in the central tendencies of the groups being compared. Rejecting the null hypothesis would indicate a significant difference in the medians, prompting further investigation.
The alternative hypothesis (H1), conversely, states that there is a significant difference between the medians of the groups. This hypothesis implies that at least one group’s median differs from the others, highlighting the presence of variability in central tendencies. By testing these hypotheses, researchers can determine whether observed differences in medians are statistically significant.
8. An Example of the Marginal Median Test
Consider a scenario where a researcher wishes to compare the median income levels of employees across three different companies. The Marginal Median Test can be employed to determine if there are significant differences in income medians between these companies. By categorising incomes as above or below the overall median, the test will reveal whether any company stands out in terms of central tendency.
Another example could involve a clinical study comparing the effectiveness of three different treatments for a medical condition. Using the Marginal Median Test, researchers can analyse the median recovery times for each treatment group. If the test indicates significant differences, it suggests that the treatments vary in their effectiveness, guiding further medical recommendations.
Step by Step: Running the Median Test in SPSS Statistics
Let’s embark on a step-by-step guide on performing the Median Test using SPSS
- Input Data: Enter your repeated measures data into separate columns in SPSS.
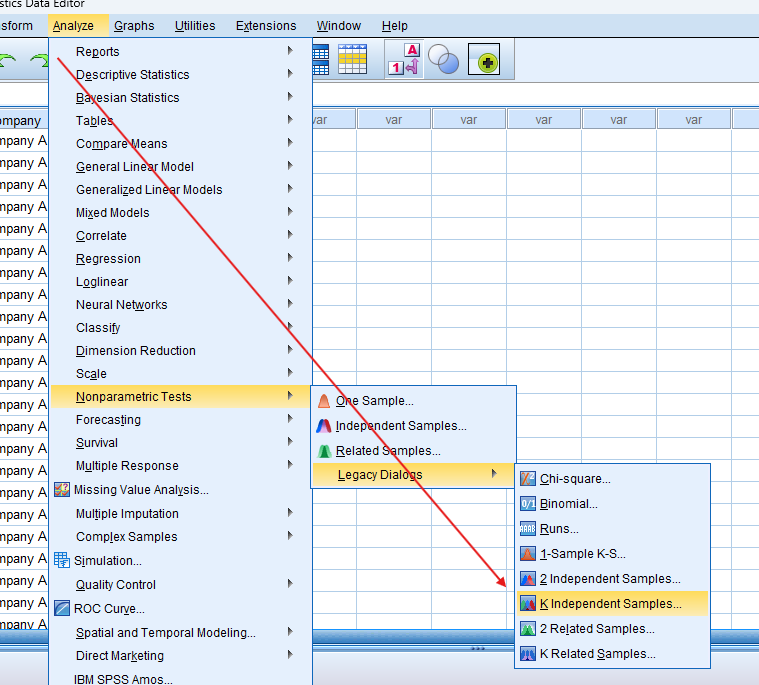
- Select Test: Navigate to `Analyze` > `Nonparametric Tests` > `K Independent Samples`.
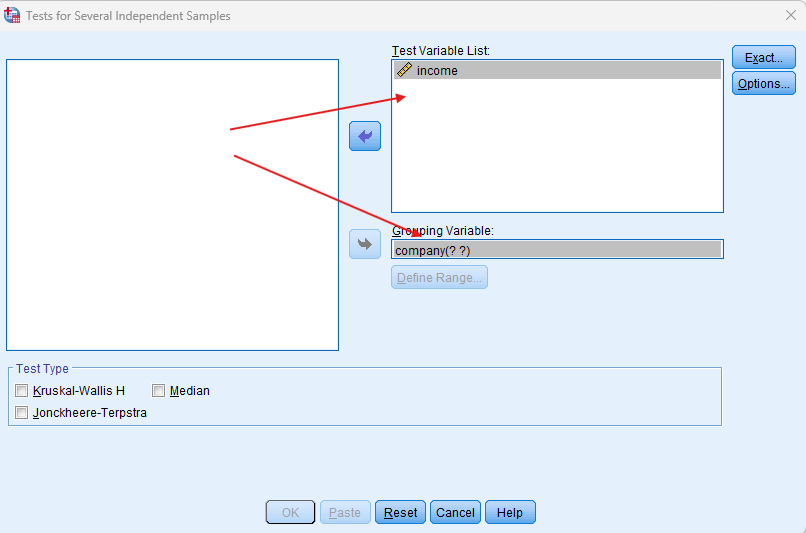
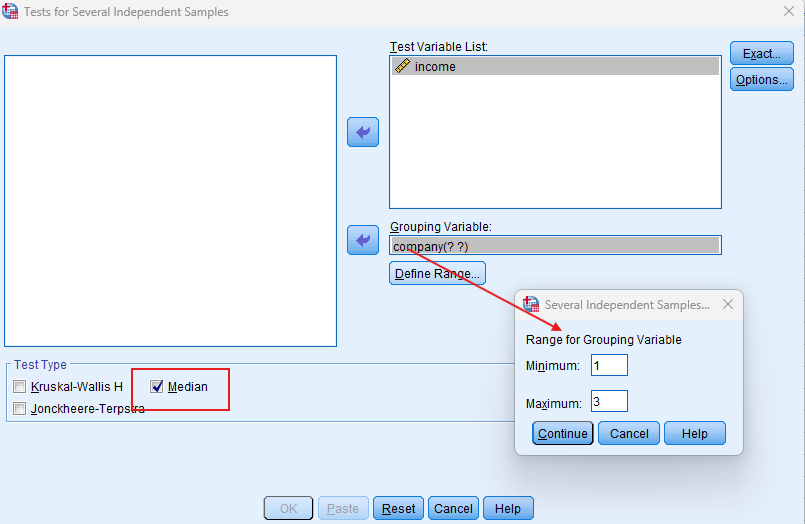
- Choose Variables: in the dialog box that appears, move your dependent variable to the ‘Test Variable List’ and your grouping variable to the ‘Grouping Variable’ box. Define the range for your grouping variable and select ‘Median’ under the ‘Test Type.’
- Run Test: Click `OK` to run the test.
- Review Output: SPSS will generate output tables with the test statistics and significance levels.
Note: Conducting the Median Test in SPSS provides a robust foundation for understanding the key features of your data. Always ensure that you consult the documentation corresponding to your SPSS version, as steps might slightly differ based on the software version in use. This guide is tailored for SPSS version 25, and for any variations, it’s recommended to refer to the software’s documentation for accurate and updated instructions.
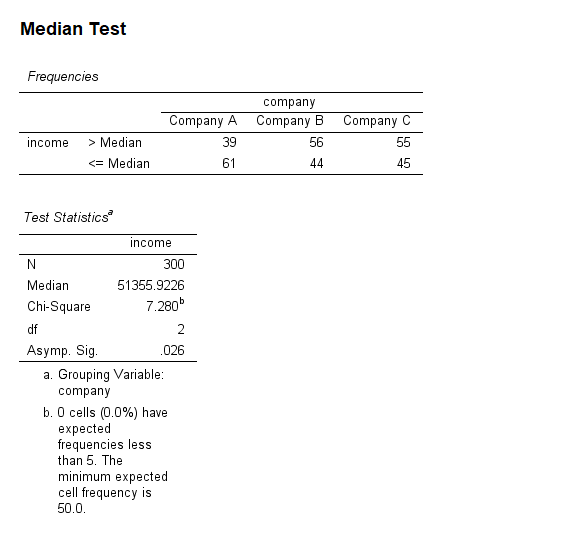
10. SPSS Output for Median Test
11. How to Interpret SPSS Output of Median Test
Firstly, examine the SPSS output table for the Median Test, focusing on the ‘Test Statistics’ section. The key values to look for are the chi-square statistic and the associated p-value. The chi-square statistic indicates the degree of difference between the medians of the groups, while the p-value helps determine the statistical significance of this difference. A p-value less than 0.05 typically indicates a significant difference in medians.
Secondly, review the ‘Descriptive Statistics’ table, which provides the median values for each group. Comparing these medians can give you a practical understanding of the differences observed. Additionally, ensure to check the assumptions and any warnings SPSS might highlight regarding your data, as these can impact the validity of your results.
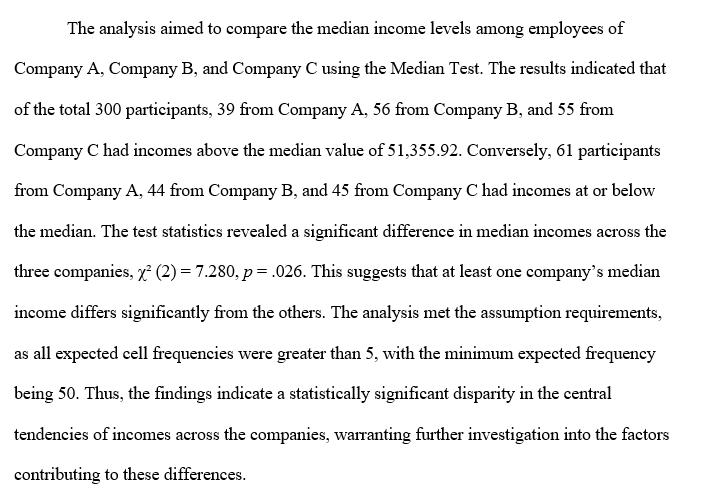
12. How to Report Results of the MedianTest in APA
Reporting the results of the Median Test in APA (American Psychological Association) format requires a structured presentation. Here’s a step-by-step guide in list format:
- Start with a clear statement of the research question or hypothesis.
- Describe the sample, including the number of participants and any relevant demographic information.
- Explain the procedure used for the Median Test, mentioning SPSS as the tool for analysis.
- Present the results, including the chi-square statistic, degrees of freedom, and p-value (e.g., χ2(2) = 5.12, p = .024).
- Interpret the results, indicating whether the null hypothesis was rejected or not.
- Discuss the implications of the findings in the context of the research question.
- Include any limitations of the study and suggest directions for future research.
Get Help For Your SPSS Analysis
Embark on a seamless research journey with SPSSAnalysis.com, where our dedicated team provides expert data analysis assistance for students, academicians, and individuals. We ensure your research is elevated with precision. Explore our pages;
- SPSS Help by Subjects Area: Psychology, Sociology, Nursing, Education, Medical, Healthcare, Epidemiology, Marketing
- Dissertation Methodology Help
- Dissertation Data Analysis Help
- Dissertation Results Help
- Pay Someone to Do My Data Analysis
- Hire a Statistician for Dissertation
- Statistics Help for DNP Dissertation
- Pay Someone to Do My Dissertation Statistics
Connect with us at SPSSAnalysis.com to empower your research endeavors and achieve impactful data analysis results. Get a FREE Quote Today!