Binomial Test in SPSS
Discover the Binomial Test in SPSS! Learn how to perform, understand SPSS output, and report results in APA style. Check out this simple, easy-to-follow guide below for a quick read!
Struggling with the Binomial Test in SPSS? We’re here to help. We offer comprehensive assistance to students, covering assignments, dissertations, research, and more. Request Quote Now!
1. Introduction
The Binomial Test in SPSS serves as an essential tool for statisticians and researchers, providing a method to assess the success probabilities of binary outcomes. Utilising SPSS for this test ensures accuracy and efficiency, making it accessible even to those with limited statistical backgrounds. This article delves into the intricacies of the Binomial Test, guiding you through its applications, assumptions, and execution within SPSS, alongside its interpretation and reporting in APA style.
Understanding the Binomial Test is crucial for anyone involved in data analysis where binary outcomes are prevalent. Firstly, we will explore the fundamental aspects of the Binomial Test in statistics. Following this, we will examine its uses and compare it with the Chi-Square Test, highlighting their differences. Moreover, we will delve into the assumptions underlying the Binomial Test, its hypotheses, and practical examples. Lastly, we will provide a comprehensive, step-by-step guide to performing the test in SPSS, interpreting the output, and reporting the results in APA format.
2. Binomial Test in Statistics
The Binomial Test is a statistical method used to determine if the proportion of successes in a binary experiment differs from a hypothesised probability. This test is particularly useful when dealing with dichotomous data, such as yes/no or success/failure outcomes. In essence, it evaluates whether the observed data significantly deviates from what we would expect under a specified probability model.
Statisticians often employ the Binomial Test when the sample size is small, and the normal approximation may not hold. Unlike other tests, the Binomial Test does not require large sample sizes to yield reliable results. It is grounded in the principles of the binomial distribution, which models the number of successes in a fixed number of independent Bernoulli trials. This makes it a robust tool for various research scenarios.
3. What is the Binomial Test used for?
Researchers use the Binomial Test to assess the validity of hypotheses about the probability of success in a given dataset. For instance, it helps in determining whether a new treatment’s success rate significantly differs from an established standard. This makes it a valuable tool in clinical trials, quality control, and survey analysis where outcomes are binary.
Moreover, the Binomial Test finds applications in market research, where companies might want to test the success rate of a new product compared to a historical success rate. It provides a straightforward method to analyse whether observed proportions differ from expected proportions under a given probability model. Thus, the Binomial Test is versatile, spanning across various fields requiring binary outcome analysis.
4. Binomial Test vs Chi-Square Test
The Binomial Test and Chi-Square Test are both used to analyse categorical data, but they serve different purposes and are applied under different conditions. The Binomial Test is best suited for small sample sizes and situations where you test the probability of success in binary outcomes. It is particularly useful when the data set does not meet the assumptions necessary for the Chi-Square Test.
In contrast, the Chi-Square Test is used to compare observed frequencies with expected frequencies across multiple categories. It requires larger sample sizes to ensure accurate results and relies on the assumption that the sample data is large enough for the Chi-Square distribution to approximate the actual distribution of the data. Additionally, the Chi-Square Test can handle more than two categories, making it ideal for more complex categorical data analysis. While both tests have their strengths, choosing between them depends on the specific characteristics and requirements of your dataset.
5. What Are Other Nonparametric Tests?
- Mann-Whitney U Test: Compares differences between two independent groups when the data are not normally distributed.
- Kruskal-Wallis Test: Extends the Mann-Whitney U Test to more than two groups, assessing rank differences—nonparametric alternative to One-Way ANOVA Test.
- Wilcoxon Signed-Rank Test: Compares two related samples or repeated measurements on a single sample to assess differences in their ranks.
- McNemar Test: Used for paired nominal data to determine changes in proportions.
- Friedman Test: Nonparametric alternative to repeated measures ANOVA, comparing ranks across multiple related groups.
- Sign Test: Evaluates the median of a single sample or compares medians of two related samples.
- Cochran’s Q Test: Extension of the McNemar test for more than two related groups.
- Kendall’s W: Assesses the agreement between raters.
- Jonckheere-Terpstra Test: Tests for ordered differences among groups.
- Wald-Wolfowitz Runs Test: Evaluates the randomness of a sequence.
- Marginal Homogeneity Test: Assesses changes in proportions in paired categorical data.
- Median Test: Compares the medians of two or more groups.
6. The Assumptions of the Binomial Test
When conducting a Binomial Test, several assumptions must be met to ensure the validity of the results. These include:
- Binary Outcomes: The data should consist of two possible outcomes, such as success/failure or yes/no.
- Fixed Number of Trials: The number of trials or observations must be fixed and determined in advance.
- Independence: Each trial should be independent, meaning the outcome of one trial does not affect the outcome of another.
- Constant Probability: The probability of success should remain constant across all trials.
Meeting these assumptions is crucial for the Binomial Test to yield accurate and meaningful results. Failure to adhere to these assumptions can lead to incorrect conclusions and reduce the reliability of the test.
7. The Hypothesis of the Binomial Test
The Binomial Test evaluates two hypotheses: the null hypothesis and the alternative hypothesis.
- Null hypothesis (H0) posits that the probability of success in the population is equal to a specified value, typically denoted as p0.
- Alternative hypothesis (H1) suggests that the probability of success differs from p0.
Firstly, under the null hypothesis, any deviation from the expected proportion is attributed to random chance. For example, if a coin is fair, the null hypothesis would state that the probability of getting heads is 0.5. Secondly, the alternative hypothesis would claim that the probability of getting heads is not equal to 0.5, indicating a bias in the coin. The Binomial Test thus provides a framework to test these hypotheses and determine if observed data supports or refutes the null hypothesis.
8. An Example of the Binomial Test
Consider a clinical trial testing a new drug designed to improve patient recovery rates. Suppose researchers wish to determine if the drug has a higher success rate than the standard treatment, which has a success probability of 0.6. In this scenario, the null hypothesis would assert that the new drug’s success rate is also 0.6, while the alternative hypothesis would contend that it is different from 0.6.
Firstly, researchers administer the drug to a sample of 30 patients, observing 22 successful recoveries. Using the Binomial Test, they compare the observed proportion (22/30) to the hypothesised proportion (0.6). If the p-value obtained from the test is less than a predetermined significance level (e.g., 0.05), the null hypothesis is rejected, suggesting the new drug’s success rate significantly differs from the standard treatment.
Step by Step: Running the Binomial in SPSS Statistics
Let’s embark on a step-by-step guide on performing the Binomial Test using SPSS
- Input Data: Enter your binary data into SPSS, ensuring that one column represents the outcome variable with two categories
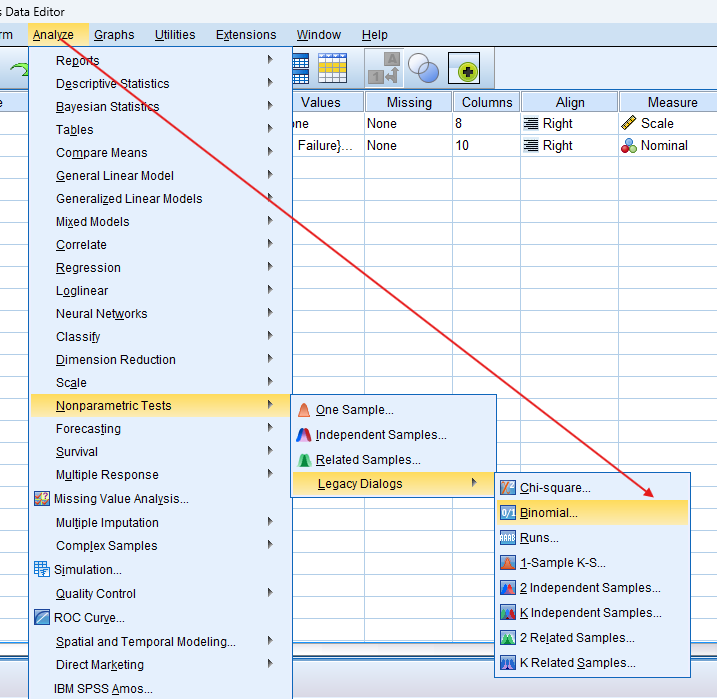
- Select Test: Navigate to `Analyze` > `Nonparametric Tests` > ‘Legacy Dialogs’ > ‘Binomial.’
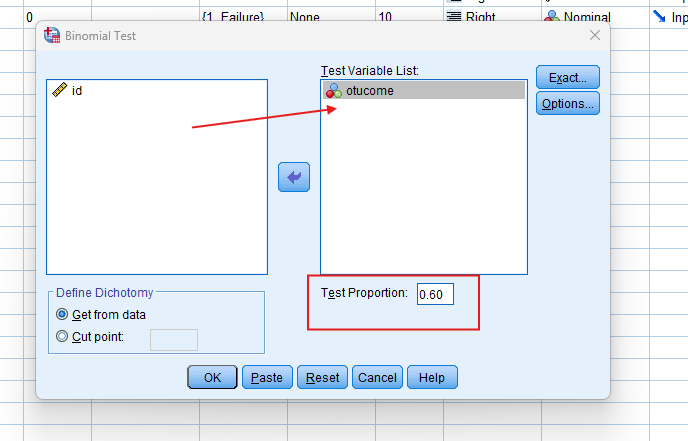
- Choose Variables: select your outcome variable for the ‘Test Variable List’ and specify the ‘Test Proportion,’ which is the hypothesised probability of success
- Run Test: Click `OK` to run the test.
- Review Output: SPSS will generate output tables with the test statistics and significance levels.
Note: Conducting the Binomial Test in SPSS provides a robust foundation for understanding the key features of your data. Always ensure that you consult the documentation corresponding to your SPSS version, as steps might slightly differ based on the software version in use. This guide is tailored for SPSS version 25, and for any variations, it’s recommended to refer to the software’s documentation for accurate and updated instructions.
10. SPSS Output for Binomial Test
11. How to Interpret SPSS Output of Binomial Test
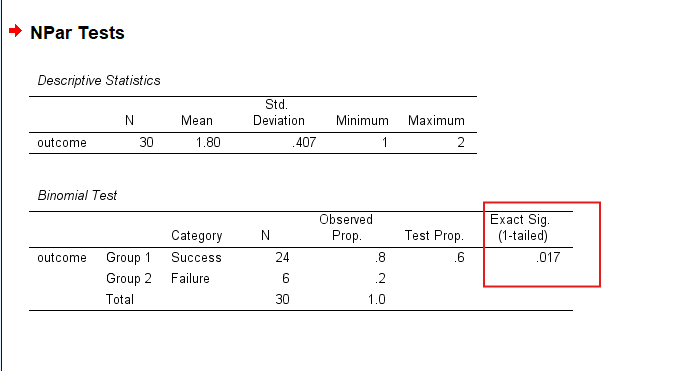
Interpreting the SPSS output for the Binomial Test involves examining several key components. Firstly, the output will display a table summarising the observed and expected frequencies for each category of the outcome variable. This table provides a visual representation of how your observed data compares to the hypothesised proportions.
Secondly, pay attention to the p-value reported in the output. If the p-value is less than the chosen significance level (e.g., 0.05), you reject the null hypothesis, indicating that the observed proportion significantly differs from the hypothesised proportion. Additionally, SPSS provides a confidence interval for the proportion estimate, offering further insight into the precision of your results.
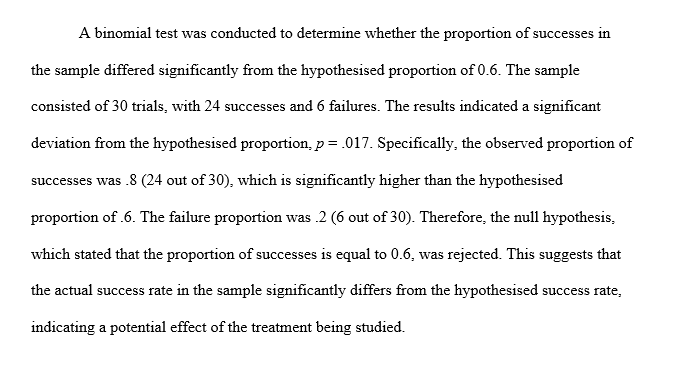
12. How to Report Results of the Binomial Test in APA
Reporting the results of a Binomial Test in APA style requires adherence to specific guidelines. These include:
- State the Hypotheses: Clearly articulate the null and alternative hypotheses.
- Describe the Procedure: Outline the process of data collection and the number of trials conducted.
- Report the Test Results: Include the observed and expected frequencies, test proportion, and p-value.
- Interpret the Findings: Provide a concise interpretation of the results, indicating whether the null hypothesis was rejected or not.
- Confidence Interval: Mention the confidence interval for the proportion estimate, if available.
By following these guidelines, you ensure your report is clear, precise, and adheres to APA standards, facilitating the accurate communication of your statistical findings.
Get Help For Your SPSS Analysis
Embark on a seamless research journey with SPSSAnalysis.com, where our dedicated team provides expert data analysis assistance for students, academicians, and individuals. We ensure your research is elevated with precision. Explore our pages;
- SPSS Help by Subjects Area: Psychology, Sociology, Nursing, Education, Medical, Healthcare, Epidemiology, Marketing
- Dissertation Methodology Help
- Dissertation Data Analysis Help
- Dissertation Results Help
- Pay Someone to Do My Data Analysis
- Hire a Statistician for Dissertation
- Statistics Help for DNP Dissertation
- Pay Someone to Do My Dissertation Statistics
Connect with us at SPSSAnalysis.com to empower your research endeavors and achieve impactful data analysis results. Get a FREE Quote Today!