Chi-Square Test in SPSS
Discover the Chi-Square Test in SPSS! Learn how to perform, understand SPSS output, and report results in APA style. Check out this simple, easy-to-follow guide below for a quick read!
Struggling with the Chi-Square Test in SPSS? We’re here to help. We offer comprehensive assistance to students, covering assignments, dissertations, research, and more. Request Quote Now!

Introduction
Welcome to our comprehensive guide on the Chi-Square Test in SPSS, a powerful statistical method used for categorical data analysis. Understanding the Chi-Square Test is crucial for researchers, analysts, and students in various fields. This test allows us to determine if there is a significant association between categorical variables, providing valuable insights into the relationships within data sets. As we delve into the intricacies of this statistical tool, we aim to demystify its concepts, highlight its significance, and equip you with the knowledge needed to conduct and interpret Chi-Square tests effectively in SPSS.
What is the Chi-Square Test?
The Chi-Square Test, a non-parametric statistical test, assesses the association between categorical variables. Unlike tests involving means or variances, the Chi-Square Test focuses on the frequencies of observations within different categories. By comparing observed and expected frequencies, the test determines if the differences are statistically significant. This method is particularly valuable when working with nominal or ordinal data, where the variables under consideration lack a natural numerical scale.
In essence, the Chi-Square Test enables researchers to uncover patterns, dependencies, or independence within categorical data sets, making it a versatile tool in the realm of statistical analysis.
Chi-Square (Χ²) Tests | Types
The chi-square test is a statistical test used to determine if there is a significant association between two categorical variables. Understanding these test types is crucial for selecting the appropriate method based on the research objectives.
There are different types of chi-square tests, and they are used for various purposes. Here are some common types:
1. Chi-Square Test of Independence:
– Chi-Square Test of Independence or Chi-Square Test For Association: Used to determine whether there is a significant association between two categorical variables.
– Example: Testing whether there is a relationship between gender and smoking status.
2. Chi-Square Test for Goodness of Fit:
– Chi-Square Test for Goodness of Fit: Used to assess whether the observed frequency distribution of a categorical variable matches the expected distribution.
– Example: Testing whether the distribution of blood types in a population follows the expected ratios.
3. Chi-Square Test for Homogeneity:
– Chi-Square test for Homogeneity: Similar to the test for independence but is used when comparing the distribution of a categorical variable across multiple groups or conditions.
– Example: Testing whether the distribution of political affiliations is the same among different age groups.
4. Yates’ Continuity Correction:
– A modification of the chi-square test for a 2×2 contingency table to correct for the potential bias in small sample sizes.
– Typically applied when the sample size is small and the expected frequencies are close to 5 or below.
5. Mantel-Haenszel Chi-Square Test:
– Used for analysing the association between two dichotomous variables while controlling for a third variable (stratification).
– Often used in epidemiological studies to examine the relationship between exposure and disease while controlling for a confounding variable.
6. Fisher’s Exact Test:
– Fisher’s Exact Test: While not technically a chi-square test, Fisher’s exact test is often used when dealing with small sample sizes and 2×2 contingency tables.
– It is an exact test and doesn’t rely on the chi-square distribution approximation.
These tests are applied based on the nature of the research question and the type of data being analyzed. The appropriate choice depends on the specific characteristics of the study design and the data collected.
The Aim of the Chi-Square Test for Independence
The primary aim of the Chi-Square test for Independence is to examine whether there is a significant association between two categorical variables. In other words, it helps researchers determine whether changes in one variable are related to changes in another. This test seeks to uncover patterns, dependencies, or lack thereof, providing valuable insights into the nature of the relationship between the variables under investigation.
By scrutinizing observed and expected frequencies, researchers can discern whether the observed pattern is likely due to chance or if there is a genuine association, making the Chi-Square test for Independence a fundamental tool for categorical data analysis.
Assumption of Chi-Square test for Independence
While the Chi-Square test for Independence is robust and versatile, it is essential to consider certain assumptions before applying the test. Here are the assumptions of the chi-square test
- Independence of Observations: The data used in the analysis should consist of independent observations.
- Categorical Variables: The variables being analysed must be categorical.
- Expected Frequencies: The expected frequency for each cell in the contingency table should be at least five.
Violating these assumptions may compromise the validity of the results. Therefore, researchers must carefully evaluate their data to ensure it meets these criteria before conducting a Chi-Square test for Independence. Understanding and adhering to these assumptions are crucial for the accurate interpretation of the test results and the reliability of the conclusions drawn from the analysis.
Example of Chi-Square Test for Independence
To illustrate the practical application of the Chi-Square Test for Independence, consider a study examining the relationship between gender and preferences for a particular product. The researcher collects data on a sample of individuals, categorizing them based on gender (male or female) and their preference for the product (Option A, Option B, or No Preference).
By constructing a contingency table and applying the Chi-Square Test for Independence, the researcher can determine whether there is a significant association between gender and product preference. The test results may reveal whether gender influences the choice of product, providing valuable insights for marketing strategies or product development.

Step by Step: Running Chi-Square for Independence in SPSS Statistics
Conducting a Chi-Square Test for Independence in SPSS involves a series of steps to ensure accurate and reliable results.
- STEP: Load Data into SPSS
Commence by launching SPSS and loading your dataset, which should encompass the variables of interest – a categorical independent variable. If your data is not already in SPSS format, you can import it by navigating to File > Open > Data and selecting your data file.
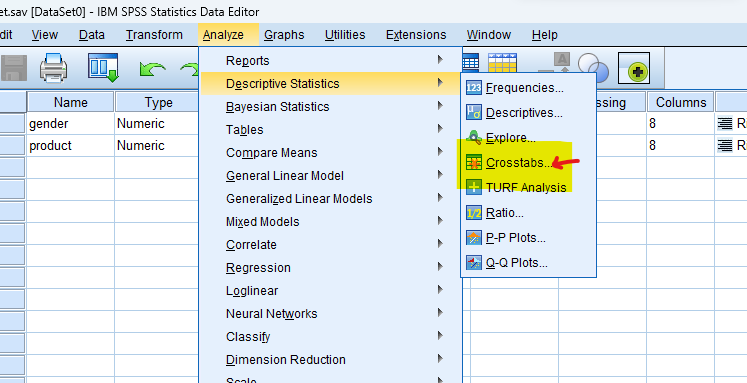
- STEP: Access the Analyze Menu
In the top menu, locate and click on “Analyze.” Within the “Analyze” menu, navigate to “Descriptive Statistics” and choose ” Crosstabs.” Analyze > Descriptive Statistics > Crosstabs
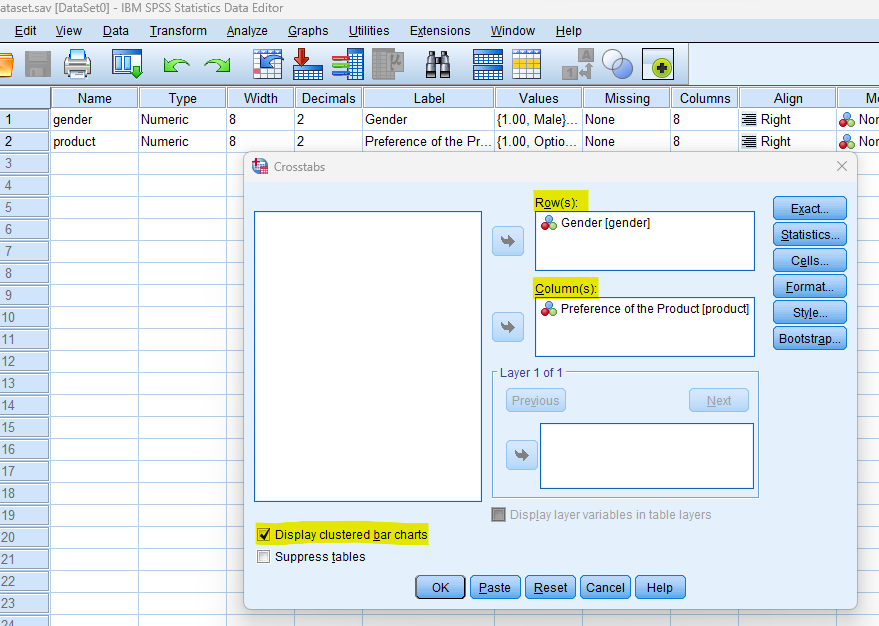
- STEP: Specify Variables
In the “Crosstabs” dialogue box, select the variables you want to analyze. Place one variable in the “Rows” box and the other in the “Columns” box. Check “Display clustered bar charts”
- STEP: Define Statistics
Click on the “Statistics” button and choose “Chi-Square” from the list. You may also select other statistics if needed.
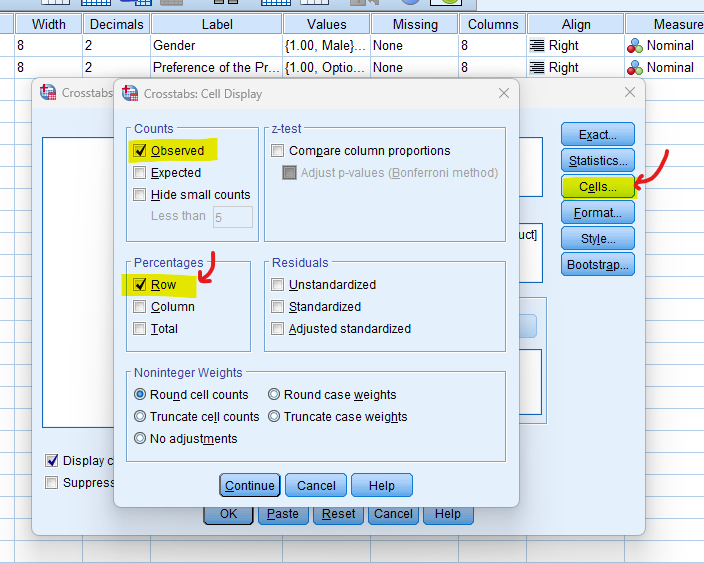
- STEP: Include Percentages
Under the “Cells” button, check “Row” to include row percentages in the output. Click “Continue.”
- STEP: Generate Crosstabs Table and Plot
Once you have specified your variables and chosen options, click the “OK” button to perform the analysis. SPSS will generate a comprehensive output, including the requested frequency table and chart for your dataset.
Note
Conducting a Chi-Square test in SPSS provides a robust foundation for understanding the key features of your data. Always ensure that you consult the documentation corresponding to your SPSS version, as steps might slightly differ based on the software version in use. This guide is tailored for SPSS version 25, and for any variations, it’s recommended to refer to the software’s documentation for accurate and updated instructions.


How to Interpret SPSS Output of Chi-Square Test
Interpreting the SPSS output of a Chi-Square Test for Independence is essential for drawing meaningful conclusions from the analysis. The output typically includes the Chi-Square test statistic, degrees of freedom, and the p-value.
Crosstabulation Table
it is often presented as a contingency table and displays the distribution of frequencies for each combination of the variables under analysis. It offers a snapshot of how the variables interact, showing counts in each cell.
- Percentages Row percentages may be included to provide a clearer picture of the proportion of cases within each row. This is particularly useful for understanding the distribution of one variable relative to the other, helping to identify patterns and trends.
Chi-Square Tests Table
This table presents the results of the Chi-Square Test. Key values include:
- Chi-Square Value: This statistic indicates the strength of association between the variables. A larger value suggests a stronger association.
- Degrees of Freedom (df): This represents the number of categories minus one. It’s crucial for determining the critical value from the chi-square distribution.
- p-value: The p-value is a measure of statistical significance. If it is less than the chosen significance level (commonly 0.05), you can infer a significant association between the variables.
Interpreting the results involves assessing the p-value. If it is below the significance threshold, you have evidence to reject the null hypothesis, suggesting a significant association. Additionally, consider effect size measures like Cramer’s V for insights into the practical significance of the association. In summary, the Chi-Square Test output in SPSS empowers users to make informed conclusions about the relationships within their categorical data.
How to Report Results of Chi-Square Test for Independence in APA:
When reporting the results of a Chi-Square Test for Independence in the APA (American Psychological Association) format, precision and clarity are paramount. Begin with the test statistic, degrees of freedom, and p-value.
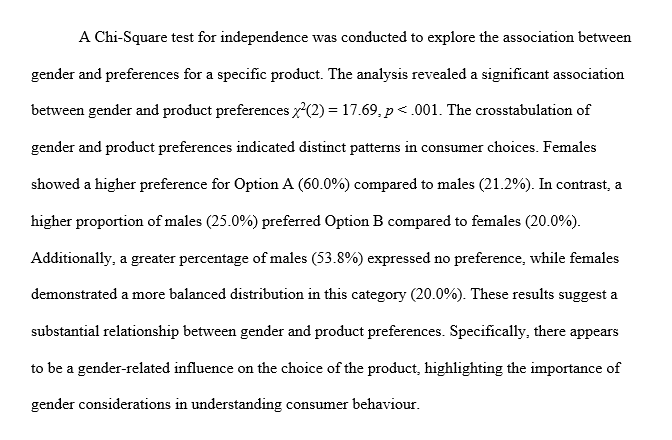
For example: “A Chi-Square test for Independence was conducted to examine the association between [Variable 1] and [Variable 2]. The analysis revealed a significant association, χ2(df) = [Chi-Square value, degrees of freedom], p < 0.05.” Provide additional information about effect size if applicable. Conclude with a brief interpretation of the findings, avoiding technical jargon to make the results accessible to a wider audience. This adherence to APA guidelines ensures the accurate and standardized communication of Chi-Square test results in scholarly and professional contexts.
Get Help for Your SPSS Analysis
Embark on a seamless research journey with SPSSAnalysis.com, where our dedicated team provides expert data analysis assistance for students, academicians, and individuals. We ensure your research is elevated with precision. Explore our pages;
- SPSS Data Analysis Help – SPSS Helper,
- Quantitative Analysis Help,
- Qualitative Analysis Help,
- SPSS Dissertation Analysis Help,
- Dissertation Statistics Help,
- Statistical Analysis Help,
- Medical Data Analysis Help.
Connect with us at SPSSAnalysis.com to empower your research endeavors and achieve impactful results. Get a Free Quote Today!