Sign Test in SPSS
Discover the Sign Test in SPSS! Learn how to perform, understand SPSS output, and report results in APA style. Check out this simple, easy-to-follow guide below for a quick read!
Struggling with the Sign Test in SPSS? We’re here to help. We offer comprehensive assistance to students, covering assignments, dissertations, research, and more. Request Quote Now!
1. Introduction
The Sign Test in SPSS serves as a powerful non-parametric tool in statistics, particularly useful for assessing the median differences between paired samples. Researchers and data analysts rely on this test to determine if there are significant differences in matched pairs. By utilising the Sign Test, one can avoid the assumptions required by parametric tests, making it a versatile option for various data types.
Understanding the application and nuances of the Sign Test in SPSS is crucial for accurate data analysis. This guide delves into the fundamentals, applications, and procedural steps of conducting the Sign Test using SPSS, ensuring that you can confidently apply this statistical method to your data. Furthermore, the guide provides insights into interpreting results and reporting them according to APA guidelines, making it a comprehensive resource for both novice and experienced users.
2. Sign Test in Statistics
The Sign Test is a non-parametric test used in statistics to determine if there is a significant difference between the medians of two related samples. Unlike parametric tests, the Sign Test does not assume normal distribution of the data, making it ideal for ordinal data or continuous data that do not meet parametric assumptions. Essentially, it evaluates the direction of differences in matched pairs rather than their magnitude.
Firstly, the Sign Test works by analysing the signs of the differences between pairs, assigning a plus or minus sign based on whether one value is higher or lower than the other. Secondly, it counts the number of positive and negative signs to test the null hypothesis that there is no median difference. This simplicity in calculation and interpretation makes the Sign Test a valuable tool in non-parametric statistical analysis.
3. What is the Sign Test used for?
Researchers use the Sign Test to compare paired observations when the data do not satisfy the assumptions required for parametric tests. For instance, it is particularly useful in situations where the sample size is small or when the data are skewed. This test is often employed in medical studies, behavioural sciences, and other fields where data may not be normally distributed.
The Sign Test can determine whether a treatment has a significant effect by comparing pre-treatment and post-treatment measurements. It is also useful for analysing changes over time or differences between two conditions in a within-subject design. By focusing on the direction of change rather than the magnitude, the Sign Test offers a robust alternative for non-parametric data analysis.
4. Sign Test Using SPSS
The Sign Test in SPSS allows users to conduct this non-parametric test with ease, leveraging the software’s powerful data analysis capabilities. SPSS provides a straightforward interface to input paired data and execute the Sign Test, streamlining the process for researchers and analysts. Users can quickly assess the direction of differences and obtain statistical results without manual calculations.
In SPSS, performing the Sign Test involves selecting the appropriate test from the menu, inputting the paired samples, and interpreting the output. The software calculates the number of positive and negative differences, providing p-values to help determine statistical significance. This functionality makes SPSS an invaluable tool for conducting the Sign Test efficiently and accurately.
5. What is the difference between the Paired T-Test, Wilcoxon Signed Rank Test, and the Sign Test?
The Paired T Test, Wilcoxon Signed Rank Test, and Sign Test all compare paired samples, but they differ in their assumptions and applications. Firstly, the Paired T Test assumes normal distribution of the differences between pairs and is suitable for interval or ratio data. It evaluates whether the mean difference is significantly different from zero.

Secondly, the Wilcoxon Signed Rank Test, a non-parametric alternative to the Paired T-Test, does not assume a normal distribution. It ranks the absolute differences and evaluates whether the median difference is significantly different from zero. Lastly, the Sign Test is the simplest, focusing only on the direction of differences and not their magnitude, making it the least powerful but most flexible option when data do not meet other test assumptions.
6. The Wilcoxon Signed Rank Test and the Sign Test
Choosing between the Wilcoxon Signed Rank Test and the Sign Test depends on the nature of your data and the assumptions you are willing to make. The Wilcoxon Signed Rank Test is more powerful than the Sign Test as it considers both the direction and magnitude of differences. It is appropriate when you have ordinal data or continuous data that do not meet the assumptions of the Paired T Test but still require a more sensitive test than the Sign Test.
On the other hand, the Sign Test should be used when your data consist of paired observations and you are only interested in the direction of change, not the magnitude. It is especially useful for small sample sizes or when the data are heavily skewed. By focusing solely on the sign of differences, the Sign Test provides a straightforward and robust method for analysing non-parametric data.
7. What Are Other Nonparametric Tests?
- Mann-Whitney U Test: Compares differences between two independent groups when the data are not normally distributed.
- Kruskal-Wallis Test: Extends the Mann-Whitney U Test to more than two groups, assessing rank differences—nonparametric alternative to One-Way ANOVA Test.
- Wilcoxon Signed-Rank Test: Compares two related samples or repeated measurements on a single sample to assess differences in their ranks.
- McNemar Test: Used for paired nominal data to determine changes in proportions.
- Friedman Test: Nonparametric alternative to repeated measures ANOVA, comparing ranks across multiple related groups.
- Cochran’s Q Test: Extension of the McNemar test for more than two related groups.
- Kendall’s W: Assesses the agreement between raters.
- Binomial Test: Tests the observed proportion against a theoretical proportion.
- Jonckheere-Terpstra Test: Tests for ordered differences among groups.
- Wald-Wolfowitz Runs Test: Evaluates the randomness of a sequence.
- Marginal Homogeneity Test: Assesses changes in proportions in paired categorical data.
- Median Test: Compares the medians of two or more groups.
8. The Assumptions of the Sign Test
The Sign Test in SPSS operates under several assumptions:
- Data consist of paired observations.
- Each pair is independent of other pairs.
- Data can be ordinal, interval, or ratio.
- The differences between pairs are analysed based on their signs (positive, negative, or zero).
By meeting these assumptions, researchers can ensure the validity and reliability of the Sign Test results, making it a versatile tool for non-parametric data analysis.
9. The Hypothesis of the Sign Test
The Sign Test in SPSS tests the null hypothesis that the median difference between paired samples is zero. This means there is no significant change or effect observed between the paired observations. If the p-value obtained from the test is less than the chosen significance level, usually 0.05, we reject the null hypothesis and conclude that there is a significant median difference between the pairs.
- Null Hypothesis (H0): the median difference between paired samples is zero.
- Alternative Hypothesis (H1): the median difference is not zero.
The alternative hypothesis states that the median difference is not zero, indicating a significant change or effect. This test is particularly useful when dealing with non-parametric data or when the assumptions of parametric tests are not met. By focusing on median differences, the Sign Test provides a robust method for hypothesis testing in various research scenarios.
10. An Example of the Sign Test
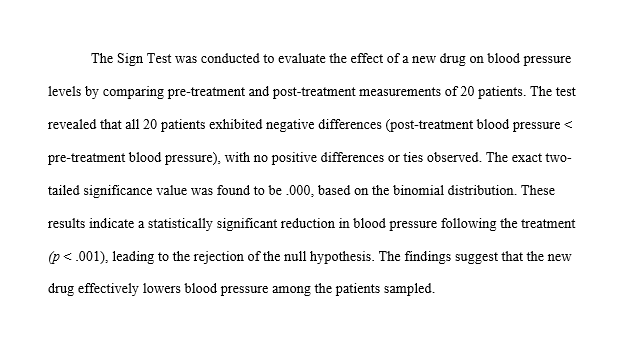
Consider a study assessing the effectiveness of a new drug on blood pressure levels. Researchers measure blood pressure before and after administering the drug to a group of patients. The paired observations, consisting of pre-treatment and post-treatment blood pressure readings, serve as the data for the Sign Test.
In SPSS, the researcher inputs the paired blood pressure readings and performs the Sign Test. The software calculates the number of positive and negative differences, providing a p-value to determine statistical significance. If the p-value is less than 0.05, the researcher concludes that the drug has a significant effect on lowering blood pressure, rejecting the null hypothesis.
Step by Step: Running the Sign Test in SPSS Statistics
Let’s embark on a step-by-step guide on performing the Sign Test using SPSS
- Input Data: Enter the data into SPSS
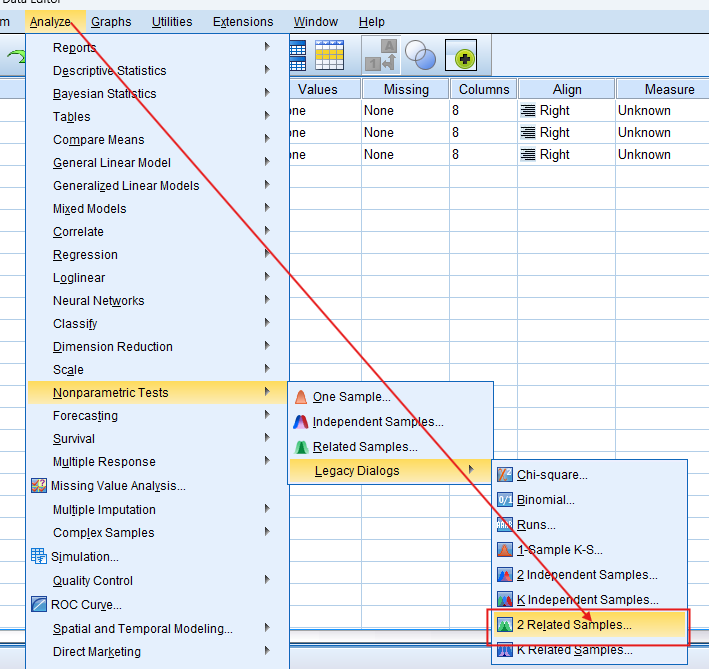
- Select the Test: Navigate to ‘Analyze’ > ‘Nonparametric Tests’ > ‘Legacy Dialogs’ > ‘Related Samples’.
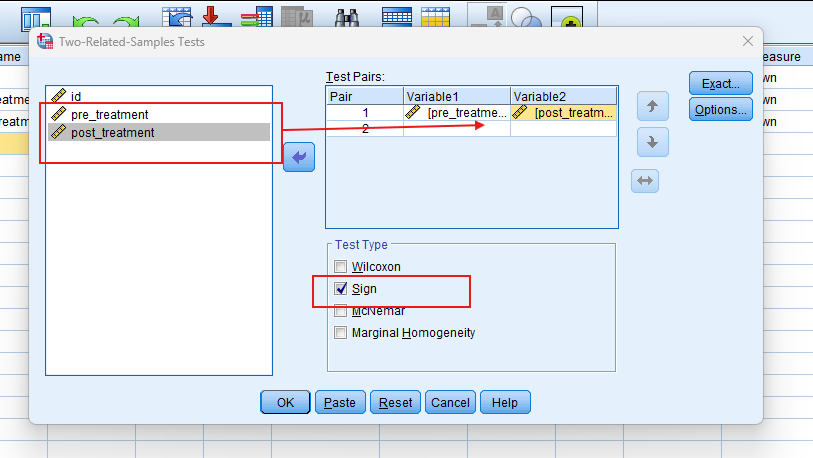
- Choose Variables: In the dialog box, move your paired variables into the Test Pairs box.
- Run the Test: Click ‘OK’ to run the Sign Test.
- Interpret Output: SPSS will provide the Exact sign (p-value). A p-value less than 0.05 indicates a significant difference between the pairs.
Note: Conducting the Sign Test in SPSS provides a robust foundation for understanding the key features of your data. Always ensure that you consult the documentation corresponding to your SPSS version, as steps might slightly differ based on the software version in use. This guide is tailored for SPSS version 25, and for any variations, it’s recommended to refer to the software’s documentation for accurate and updated instructions.
11. SPSS Output for Sign Test

12. How to Interpret SPSS Output of Sign Test
Interpreting the SPSS output of the Sign Test involves examining the table of results generated by the software. Look for the number of positive and negative differences, which indicate the direction of change between pairs. The test statistic and p-value are crucial for determining statistical significance.
If the p-value is less than your chosen significance level (usually 0.05), reject the null hypothesis and conclude that there is a significant median difference between the paired samples. The SPSS output also provides additional statistics, such as confidence intervals, which help in understanding the precision and reliability of your results. Use these insights to draw meaningful conclusions from your data analysis.
13. How to Report Results of Sign Test in APA
Reporting the results of sign test in APA (American Psychological Association) format requires a structured presentation. Here’s a step-by-step guide in list format:
- Introduction: Briefly introduce the purpose of the test and the hypothesis.
- Method: Describe the paired sample data and the procedure used to conduct the Sign Test in SPSS.
- Results: Present the test statistic, number of positive and negative differences, and the p-value.
- Interpretation: Explain whether the null hypothesis was rejected or not, and what the results indicate.
- Conclusion: Summarise the findings and their implications for your study.
By following these guidelines, you ensure that your report is clear, concise, and adheres to APA standards, making your findings easily understandable and professionally presented.
Get Help For Your SPSS Analysis
Embark on a seamless research journey with SPSSAnalysis.com, where our dedicated team provides expert data analysis assistance for students, academicians, and individuals. We ensure your research is elevated with precision. Explore our pages;
- SPSS Help by Subjects Area: Psychology, Sociology, Nursing, Education, Medical, Healthcare, Epidemiology, Marketing
- Dissertation Methodology Help
- Dissertation Data Analysis Help
- Dissertation Results Help
- Pay Someone to Do My Data Analysis
- Hire a Statistician for Dissertation
- Statistics Help for DNP Dissertation
- Pay Someone to Do My Dissertation Statistics
Connect with us at SPSSAnalysis.com to empower your research endeavors and achieve impactful data analysis results. Get a FREE Quote Today!