Relative Risk (RR) and Odds Ratio (OR)
Discover the Relative Risk and Odds Ratio in SPSS! Learn how to perform, understand SPSS output, and report results in APA style. Check out this simple, easy-to-follow guide below for a quick read!
Struggling with the Relative Risk and Odds Ratio in SPSS? We’re here to help. We offer comprehensive assistance to students, covering assignments, dissertations, research, and more. Request Quote Now!

1. Introduction
In statistical analysis, understanding the relationship between exposure and outcome is essential, especially in medical and epidemiological research. Two key measures used to quantify this relationship are Relative Risk (RR) and Odds Ratio (OR). These statistics help researchers determine whether exposure to a particular factor increases or decreases the likelihood of a specific outcome. Both RR and OR are frequently used to compare the likelihood of an event occurring in one group versus another.
In SPSS, calculating Relative Risk and Odds Ratio is straightforward, and these measures are crucial for evaluating risks and benefits in clinical trials, cohort studies, and case-control studies. In this post, we will explain what RR and OR are, how they differ, and guide you through their application in SPSS, helping you analyse risk factors accurately.
2. What is the Relative Risk (RR) in Statistics?
Relative Risk (RR) is a measure used to compare the probability of an event occurring in an exposed group with the probability of the event occurring in an unexposed group. It quantifies the risk of a certain outcome, such as disease development, in relation to exposure. If the RR is greater than 1, it indicates that exposure is associated with a higher risk of the event, while an RR less than 1 suggests a protective effect of the exposure.
RR is widely used in cohort studies, where two groups (exposed and unexposed) are followed over time to see how many participants in each group experience the event of interest. RR provides a clear and interpretable measure of how much more (or less) likely the event is in the exposed group compared to the unexposed group.

3. What is the Odds Ratio (OR) in Statistics?
Odds Ratio (OR) measures the odds of an event occurring in an exposed group compared to the odds of the event occurring in an unexposed group. While similar to Relative Risk, the OR focuses on odds rather than probabilities. The OR is commonly used in case-control studies where researchers are interested in whether certain exposures are more frequent among cases (those with the event) than among controls (those without the event).
An OR greater than 1 indicates higher odds of the event in the exposed group, while an OR less than 1 suggests lower odds. Although the OR can approximate the RR, especially in rare events, it tends to overestimate the risk when the event is common. Therefore, it is important to understand the context and study design when interpreting OR.

4. What is the Relative Risk and Odds Ratio used for?
Relative Risk and Odds Ratio are essential tools for assessing the relationship between an exposure and an outcome in medical research, epidemiology, and public health. RR is often used in cohort studies where the incidence of disease in an exposed group is compared with that in a non-exposed group. For example, researchers might use RR to examine whether smokers are more likely to develop lung cancer than non-smokers.
Odds Ratio is more commonly used in case-control studies, where researchers are interested in the odds of exposure among cases versus controls. OR is particularly useful when the outcome is rare, and it helps researchers assess whether an exposure (e.g., a lifestyle factor or treatment) increases or decreases the odds of a specific outcome occurring.
5. What is the Difference Between Relative Risk and Odds Ratio?
- Relative Risk (RR):
- Directly compares the probabilities of an event occurring in two groups (exposed vs. unexposed).
- RR is easier to interpret in cohort studies where the actual risk of an event can be measured.
- RR provides a clear understanding of how many times more (or less) likely the event is in the exposed group compared to the unexposed group.
- When RR is greater than 1, the risk is higher in the exposed group; when less than 1, the risk is lower (protective effect).
- Odds Ratio (OR):
- Compares the odds of an event occurring in the exposed group to the odds of it occurring in the unexposed group.
- OR is mainly used in case-control studies where the true probability of an event cannot be directly measured.
- OR tends to overestimate risk when the event is common but is a good approximation of RR for rare events.
- An OR greater than 1 indicates higher odds in the exposed group, while less than 1 suggests lower odds.
In summary, RR is preferred for cohort studies and provides direct risk comparisons, while OR is more suitable for case-control studies and compares odds rather than probabilities.
6. An Example of the Odds Ratio and Relative Risk
Imagine a study investigating whether a new medication reduces the risk of heart attack compared to a placebo. The study divides participants into two groups: those who receive the medication (exposed group) and those who receive the placebo (unexposed group). Over time, researchers track how many participants in each group experience a heart attack.
Using Relative Risk, the researchers calculate how much more (or less) likely participants in the medication group are to have a heart attack compared to those in the placebo group. Additionally, they calculate the Odds Ratio to compare the odds of having a heart attack in each group. Both RR and OR provide insights into the effectiveness of the medication.
Step by Step: Running Odds Ratio and Risk Relative in SPSS Statistics
Let’s embark on a step-by-step guide on calculating the Risk Relative and Odds Ratio in SPSS
- STEP: Load Data into SPSS
Commence by launching SPSS and loading your dataset, which should encompass the variables of interest – a categorical independent variable. If your data is not already in SPSS format, you can import it by navigating to File > Open > Data and selecting your data file.
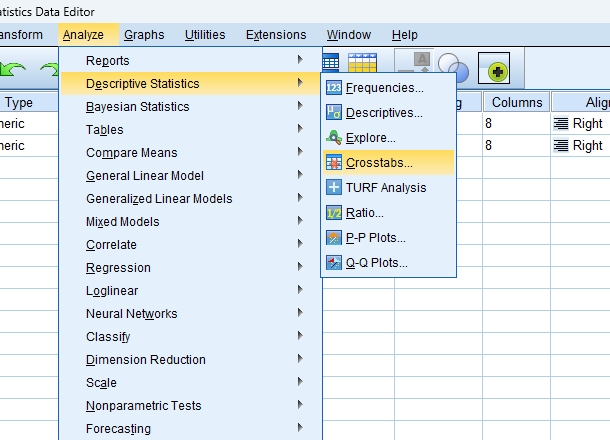
- STEP: Access the Analyze Menu
In the top menu, click on Analyse > Descriptive Statistics > Crosstabs.
- STEP: Specify Variables
- Assign one variable to the row and the other to the column in the crosstabs dialogue box.
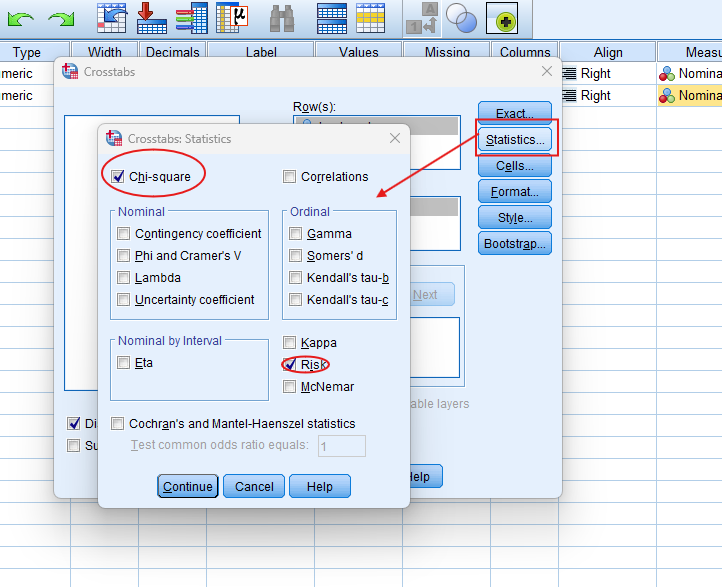
- Choose Chi-Squared: Click on the Statistics button, and select Chi-square to include the test in your output.
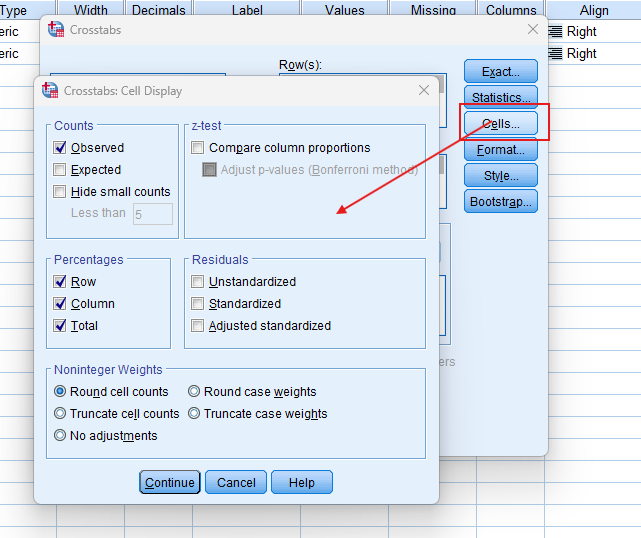
- Check Expected Counts: Enable the expected counts to compare observed and expected values.
- Click the Statistics button and check the boxes for Risk to calculate Relative Risk and Odds Ratio.
- STEP: Generate SPSS Output
- Click ‘OK’ after selecting your variables and method. SPSS will run the analysis and generate output tables and survival curves.
Note: Conducting the Odds Ratio and Relative Risk in SPSS provides a robust foundation for understanding the key features of your data. Always ensure that you consult the documentation corresponding to your SPSS version, as steps might slightly differ based on the software version in use. This guide is tailored for SPSS version 25, and for any variations, it’s recommended to refer to the software’s documentation for accurate and updated instructions.
SPSS Output for Chi Square Test (Risk Estimate: Odds Ratio and Relative Risk)


9. How to Interpret SPSS Output of Risk Estimate
SPSS will generate output, including the Crosstabulation Table, Chi-Square Tests, and Risk Estimate.
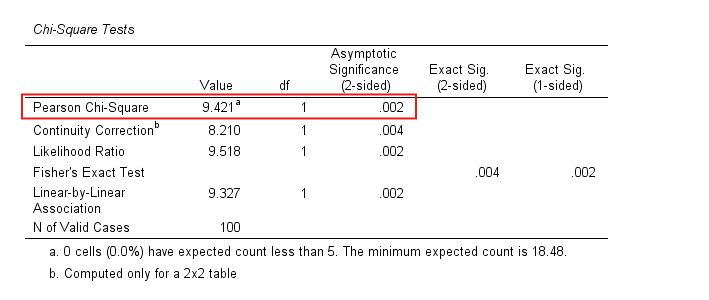
- Chi-Squared Test Table: This table provides the Chi-Square statistic, degrees of freedom (df), and the p-value. If the p-value is less than the chosen significance level (commonly 0.05).
- Crosstabulation Table: This table presents the observed and expected frequencies for each category combination of the two variables. You can also examine row and column percentages to understand the distribution of responses within each category.
- Risk Estimate Table:
- Relative Risk (RR): Provides the ratio of probabilities between the exposed and unexposed groups.
- Odds Ratio (OR): Provides the ratio of odds between the exposed and unexposed groups.
- Confidence Intervals: Displays the 95% confidence intervals for both RR and OR, indicating the range of values within which the true measure of association lies.
11. How to Report Results of Odds Ratio and Relative Risk in APA
Reporting the results of Odds Ratio and Relative Risk in APA (American Psychological Association) format requires a structured presentation. Here’s a step-by-step guide in list format:
- Introduction: Briefly describe the purpose of the analysis and the theoretical background.
- Method: Detail the data collection process, variables used, and the model specified.
- Results: Present the parameter estimates with their standard errors, and significance levels.
- Figures and Tables: Include relevant plots and tables, ensuring they are properly labeled and referenced.
- Discussion: Interpret the results, highlighting the significance of the findings and their implications.
- Conclusion: Summarise the main points and suggest potential areas for further research.

Get Support For Your SPSS Data Analysis
Embark on a seamless research journey with SPSSAnalysis.com, where our dedicated team provides expert data analysis assistance for students, academicians, and individuals. We ensure your research is elevated with precision. Explore our pages;
- Biostatistical Modeling Expert
- Statistical Methods for Clinical Studies
- Epidemiological Data Analysis
- Biostatistical Support for Researchers
- Clinical Research Data Analysis
- Medical Data Analysis Expert
- Biostatistics Consulting
- Healthcare Data Statistics Consultant
- SPSS Help by Subjects Area: Psychology, Sociology, Nursing, Education, Medical, Healthcare, Epidemiology, Marketing
Connect with us at SPSSAnalysis.com to empower your research endeavors and achieve impactful data analysis results. Get a FREE Quote Today!