Moderation Analysis in SPSS
Discover Moderation Analysis in SPSS! Learn how to perform, understand SPSS output, and report results in APA style. Check out this simple, easy-to-follow guide below for a quick read!
Struggling with Moderation Analysis in SPSS? We’re here to help. We offer comprehensive assistance to students, covering assignments, dissertations, research, and more. Request Quote Now!

Introduction
Moderation analysis is a valuable tool in research, allowing researchers to understand how the relationship between two variables changes depending on a third variable, known as the moderator. This analysis is crucial for gaining insights into complex relationships and identifying conditions under which certain effects occur. As the field of data analysis grows, the ability to perform and interpret moderation analysis becomes increasingly important.
Using SPSS, a widely-used statistical software, can simplify the process of conducting moderation analysis. This blog post aims to provide a comprehensive guide on performing moderation analysis in SPSS. We will cover the fundamental concepts, differentiate between mediation and moderation, and outline the steps and assumptions involved in testing moderation. Additionally, we will explore practical examples, interpret SPSS output, and provide guidance on reporting results in APA format.
PS: This post explains the traditional regression method in SPSS for moderation analysis. If you prefer to use the Hayes PROCESS Macro, please visit our guide on “Moderation Analysis with Hayes PROCESS Macro in SPSS.”
What is Moderation Analysis?
Moderation analysis examines how the relationship between an independent variable (X) and a dependent variable (Y) changes as a function of a third variable, called the moderator (M). The moderator can either strengthen, weaken, or reverse the effect of the independent variable on the dependent variable. By including a moderator, researchers can capture more nuanced relationships and better understand the conditions under which certain effects are stronger or weaker.

This type of analysis is particularly useful in social sciences, where the impact of one variable on another often depends on additional contextual factors. For instance, the effect of stress on performance might vary depending on levels of social support. This helps researchers identify these cofounding effects, providing deeper insights into the dynamics of the studied relationships.
What are Steps in Testing Moderation?
- Center the Moderator and Independent Variable: Mean-center the independent variable and the moderator to reduce multicollinearity and simplify the interpretation of the interaction term.
- Create Interaction Term: Multiply the centered independent variable and the centered moderator to create an interaction term.
- Run Regression Analysis: Enter the independent variable, moderator, and interaction term into a multiple regression model predicting the dependent variable.
- Plot Interaction: Plot the interaction to visualise how the relationship between the independent variable and the dependent variable changes at different levels of the moderator.
Which is the Method better: Using Hayes PROCESS Macro or Traditional Regression for Moderation Analysis?
Choosing between Hayes PROCESS Macro and traditional regression for moderation analysis depends on your research needs and statistical expertise. The Hayes PROCESS Macro offers a user-friendly interface, automating many steps of the moderation analysis and providing bootstrap confidence intervals for the interaction effects. This method reduces human error and enhances result reliability, making it a preferred choice for those who seek convenience and precision.
In contrast, traditional regression requires manual computation of interaction terms and more steps in the analysis process. While it offers flexibility and a deeper understanding of the moderation process, it demands a higher level of statistical knowledge. The regression might be better suited for researchers who prefer customising their analyses and exploring the underlying data in more detail. Both methods have their advantages, and the choice ultimately depends on the research context and the user’s familiarity with statistical tools.
In this blog, we will give details about regression for moderation analysis, but you can visit the Hayes PROCESS post to see details of the method.
What are the Assumptions of Moderation Analysis?
- Linearity: The relationships between the independent variable, moderator, and dependent variable must be linear.
- Independence of Errors: The error terms in the regression equations should be independent of each other.
- No Multicollinearity: The independent variable, moderator, and their interaction term should not be highly correlated with each other.
- Homoscedasticity: The variance of the error terms should be constant across all levels of the independent variable and the moderator.
- Normality: The residuals of the regression equations should be normally distributed.
- Measurement without Error: The variables involved in the moderation analysis should be measured accurately without error.
What is the Hypothesis of Moderation Analysis?
The primary hypothesis in moderation analysis posits that the strength or direction of the relationship between an independent variable (X) and a dependent variable (Y) depends on the level of a third variable, the moderator (M).
- H0 (The null hypothesis): The interaction term does not significantly predict the dependent variable (meaning there is no moderation effect.)
- H1 (The alternative hypothesis): the interaction term significantly predicts the dependent variable. (indicating the presence of a moderation effect.)
Testing these hypotheses involves examining the interaction term in the regression model to determine if the moderation effect is statistically significant.
An Example of Moderation Analysis
Consider a study examining the impact of work stress (X) on job performance (Y) and how this relationship is moderated by social support (M). The hypothesis posits that the negative effect of work stress on job performance will be weaker for employees with high social support compared to those with low social support. To test this, researchers would first mean-center the variables of work stress and social support.
Next, researchers would create an interaction term by multiplying the centered work stress and social support variables. By entering work stress, social support, and the interaction term into a regression model predicting job performance, researchers can assess the main effects and the interaction effect. If the interaction term is significant, it indicates that social support moderates the relationship between work stress and job performance.
How to Perform Moderation Analysis in SPSS


Step by Step: Running Moderation Analysis in SPSS Statistics
Let’s embark on a step-by-step guide on performing the Moderation Analysis using SPSS
Load Data
– Open your dataset in SPSS, ensuring it includes the independent variable (X), dependent variable (Y), and moderator (M).
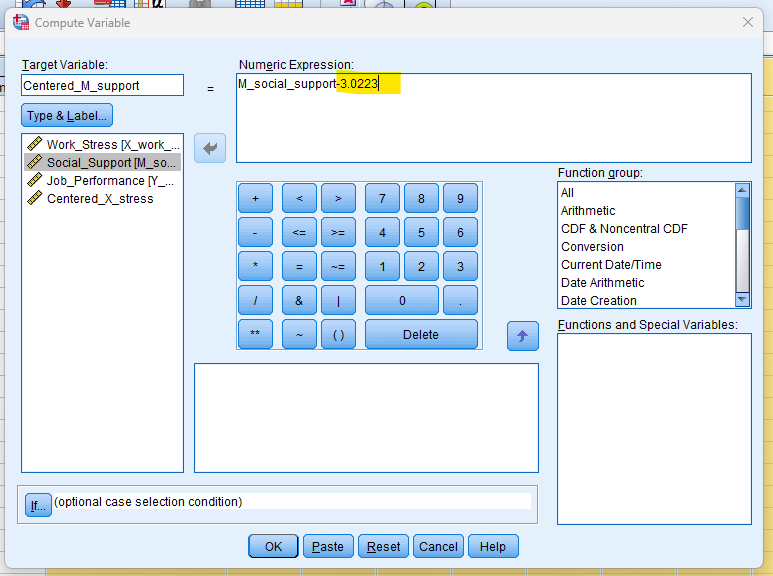
Center the Variables
– Compute the mean of the independent variable and the moderator, then subtract these means from their respective variables to create centered variables.
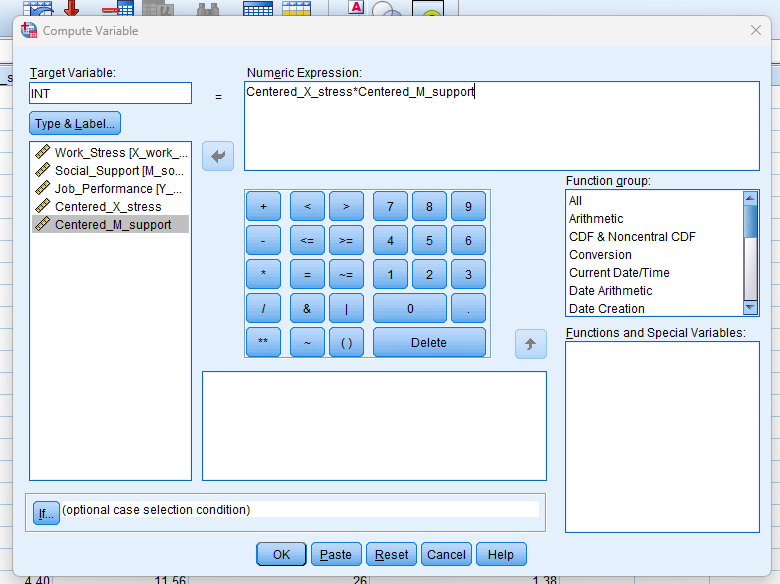
Create Interaction Term
– Multiply the centered independent variable by the centered moderator to create an interaction term.
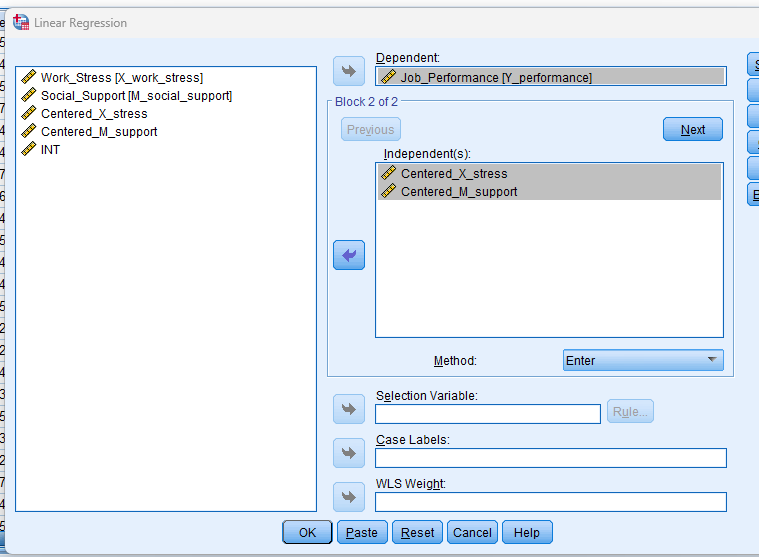
Run Regression Analysis
– Navigate to `Analyze > Regression > Linear`.
– Enter the dependent variable (Y) into the Dependent box.
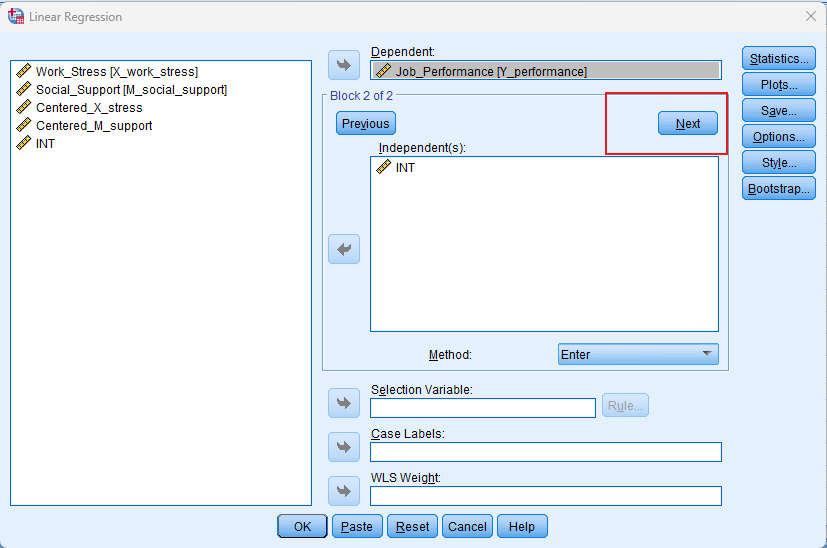
– Move the centered independent variable (X), centered moderator (M), then click Next” for block 2 enter the interaction term into the Independent box.
– Click OK to run the regression analysis.
Interpret the Output
– Examine the coefficients table to assess the significance of the independent variable, moderator, and interaction term.
– Significant interaction term indicates moderation.
Note: Conducting Moderation Analysis in SPSS provides a robust foundation for understanding the key features of your data. Always ensure that you consult the documentation corresponding to your SPSS version, as steps might slightly differ based on the software version in use. This guide is tailored for SPSS version 25, and for any variations, it’s recommended to refer to the software’s documentation for accurate and updated instructions.
SPSS Output for Moderation Analysis

How to Interpret SPSS Output of Moderation Analysis
When interpreting the SPSS output of your moderation analysis, focus on three key tables: Model Summary, ANOVA, and Coefficients.
Model Summary Table:
- R: This represents the correlation between the observed and predicted values of the dependent variable. Higher values indicate a stronger relationship.
- R Square (R²): This value indicates the proportion of variance in the dependent variable explained by the independent, moderator, and interaction variables. An R² value closer to 1 suggests a better fit.
- Adjusted R Square: Adjusts the R² value for the number of predictors in the model. This value is useful for comparing models with different numbers of predictors.
ANOVA Table:
- F-Statistic: This tests the overall significance of the model. A significant F-value (p < 0.05) indicates that the model significantly predicts the dependent variable.
- (p-value): If the p-value is less than 0.05, the model is considered statistically significant, meaning the independent and mediator variables together significantly predict the dependent variable.
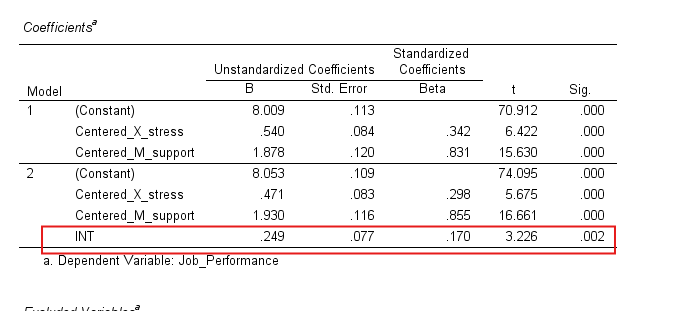
Coefficients Table:
- Unstandardized Coefficients (B): Coefficient of variable
- Constant (Intercept): The expected value of the dependent variable when all predictors are zero.
- Standardized Coefficients (Beta): These coefficients are useful for comparing the relative strength of each predictor in the model.
- t-Statistic and Sig. (p-value): Indicates whether each predictor is significantly contributing to the model. If the p-value is less than 0.05, the predictor is considered statistically significant.
By focusing on these tables, you can effectively interpret the results of your mediation analysis in SPSS, identifying the direct and indirect effects, as well as the overall model significance.
How to Report Results of Moderation Analysis in APA
Reporting the results of moderation analysis in APA (American Psychological Association) format requires a structured presentation. Here’s a step-by-step guide in list format:
- Introduction: Briefly describe the purpose of the moderation analysis and the variables involved.
- Descriptive Statistics: Report the means and standard deviations of the independent variable, moderator, and dependent variable.
- Main Effects: Provide the regression coefficients, standard errors, and p-values for the independent variable and moderator.
- Interaction Effect: Report the regression coefficient, standard error, and p-value for the interaction term.
- Model Summary: Include R² and adjusted R² values to indicate the model fit.
- Significance Tests: Present the results of the F-test and the significance levels for the overall model.
- Plot Interaction: Include a plot illustrating the interaction effect, showing how the relationship between the independent variable and the dependent variable changes at different levels of the moderator.
- Figures and Tables: Provide tables and figures to visually represent the statistical results and interaction effects.
- Conclusion: Summarise the key results and suggest directions for future research.

Get Help For Your SPSS Analysis
Embark on a seamless research journey with SPSSAnalysis.com, where our dedicated team provides expert data analysis assistance for students, academicians, and individuals. We ensure your research is elevated with precision. Explore our pages;
- SPSS Help by Subjects Area: Psychology, Sociology, Nursing, Education, Medical, Healthcare, Epidemiology, Marketing
- Dissertation Methodology Help
- Dissertation Data Analysis Help
- Dissertation Results Help
- Pay Someone to Do My Data Analysis
- Hire a Statistician for Dissertation
- Statistics Help for DNP Dissertation
- Pay Someone to Do My Dissertation Statistics
Connect with us at SPSSAnalysis.com to empower your research endeavors and achieve impactful data analysis results. Get a FREE Quote Today!