McNemar's Test in SPSS
Discover the McNemar’s Test in SPSS! Learn how to perform, understand SPSS output, and report results in APA style. Check out this simple, easy-to-follow guide below for a quick read!
Struggling with McNemar’s Test in SPSS? We’re here to help. We offer comprehensive assistance to students, covering assignments, dissertations, research, and more. Request Quote Now!
1. Introduction
McNemar’s Test in SPSS stands as a pivotal tool in statistical analysis, specifically designed for assessing paired nominal data. This non-parametric test, rooted in the work of Quinn McNemar, evaluates changes in responses before and after an intervention. As such, it finds extensive application across various fields, including medical research, psychology, and social sciences, where understanding shifts in categorical variables is crucial. Notably, using McNemar’s Test in SPSS allows researchers to conduct this analysis efficiently, harnessing the powerful computational capabilities of the software.
In the realm of data analysis, the importance of choosing the correct statistical test cannot be overstated. McNemar’s Test offers a robust method for detecting changes in paired samples, distinguishing it from other tests that might not suit categorical data. Furthermore, the guide provides insights into interpreting results and reporting them according to APA guidelines, making it a comprehensive resource for both novice and experienced users.
2. McNemar’s Test in Statistics
McNemar’s Test, a cornerstone in statistical analysis, specifically addresses paired nominal data. This test, developed by Quinn McNemar in 1947, determines whether there are significant differences in the distribution of categorical variables. Unlike other tests focusing on continuous data, It excels in scenarios where the data comprises two related samples, making it indispensable in various research fields.
At its core, This Test evaluates the consistency of outcomes before and after an intervention or between two conditions. It hinges on the principle of comparing proportions of discordant pairs, those where the responses differ, to ascertain any significant change. Lastly, this methodology ensures precise insights into the effectiveness of treatments, interventions, or changes in conditions, highlighting its utility in fields ranging from medical research to social sciences.
3. What is the McNemar’s Test used for?
Primarily, researchers employ McNemar’s Test to examine changes in paired categorical data. This application is particularly prevalent in clinical trials, where it assesses the efficacy of treatments by comparing patient responses before and after the intervention. Similarly, in psychology, it evaluates shifts in attitudes or behaviours following specific stimuli or therapy sessions. The test’s versatility extends to various disciplines, making it a valuable tool for analyzing paired nominal data.
Secondly, The test is instrumental in studies involving matched pairs or repeated measures. For example, it helps determine if there is a significant difference in pre-test and post-test results, especially when dealing with yes/no or presence/absence data. By focusing on the discordant pairs, where one element changes while the other does not, McNemar’s Test provides a clear picture of any significant alterations, thus ensuring accurate and reliable conclusions in research findings.
4. The McNemar’s Test in SPSS
In SPSS, McNemar’s Test becomes a straightforward process, allowing researchers to harness the software’s capabilities for efficient data analysis. IBM SPSS offers a user-friendly interface, guiding users through setting up their data, performing the test, and interpreting the results. The software’s in-built functions ensure accuracy, eliminating the potential for manual calculation errors and streamlining the analysis process.
Firstly, users input their paired nominal data into SPSS, ensuring the data is properly formatted for the test. SPSS then performs the McNemar’s Test, providing detailed output that includes the test statistic and p-value. This output enables researchers to determine if there are significant changes in their data, facilitating informed decisions based on robust statistical evidence. The simplicity and precision of McNemar’s Test in SPSS make it an invaluable tool for analysing paired categorical data.
5. The Paired T-Test Vs. McNemar’s Test
McNemar’s Test and the Paired t-test serve different purposes in statistical analysis. The dependent t-test is suitable for continuous data, comparing the means of two related groups to determine if there is a significant difference. Conversely, McNemar’s Test focuses on paired nominal data, assessing changes in categorical variables between two related samples. This fundamental difference underscores the importance of choosing the correct test based on the data type and research question.
Another key distinction lies in their application scenarios. Researchers use the Paired T-Test for data measured on an interval or ratio scale, such as test scores or measurements. In contrast, McNemar’s Test applies to binary or categorical data, such as yes/no responses or presence/absence of a condition. Understanding these differences ensures that researchers select the most appropriate test, thereby obtaining valid and reliable results from their data analysis efforts.
6. When to use: Wilcoxon Signed Rank Test, Sign Test, and McNemar’s Test
Firstly, the Wilcoxon Signed Rank Test is appropriate for comparing two related samples when the data is continuous but not normally distributed. This non-parametric test assesses the differences between paired observations, making it a robust alternative to the Paired T Test when the normality assumption is violated. It’s particularly useful in small sample sizes where the data might not follow a normal distribution.

Secondly, the Sign Test is another non-parametric test used for paired data, focusing on the direction of differences rather than their magnitude. This test is less powerful than the Wilcoxon Signed Rank Test but is simpler to apply, especially when the data involves ordinal or nominal scales. McNemar’s Test, on the other hand, is specific to paired nominal data, assessing changes in categorical variables between two related groups. Choosing between these tests depends on the nature of the data and the specific research question.
7. What Are Other Nonparametric Tests?
- Mann-Whitney U Test: Compares differences between two independent groups when the data are not normally distributed.
- Kruskal-Wallis Test: Extends the Mann-Whitney U Test to more than two groups, assessing rank differences—nonparametric alternative to One-Way ANOVA Test.
- Wilcoxon Signed-Rank Test: Compares two related samples or repeated measurements on a single sample to assess differences in their ranks.
- Friedman Test: Nonparametric alternative to repeated measures ANOVA, comparing ranks across multiple related groups.
- Sign Test: Evaluates the median of a single sample or compares medians of two related samples.
- Cochran’s Q Test: Extension of the McNemar test for more than two related groups.
- Kendall’s W: Assesses the agreement between raters.
- Binomial Test: Tests the observed proportion against a theoretical proportion.
- Jonckheere-Terpstra Test: Tests for ordered differences among groups.
- Wald-Wolfowitz Runs Test: Evaluates the randomness of a sequence.
- Marginal Homogeneity Test: Assesses changes in proportions in paired categorical data.
- Median Test: Compares the medians of two or more groups.
8. Assumptions of the McNemar’s Test
- Paired Data: McNemar’s Test requires that the data comes from paired or matched samples.
- Categorical Variables: The test is suitable for binary or categorical data.
- Sufficient Sample Size: Adequate sample size is necessary to ensure the test’s validity, typically with a minimum of 10 discordant pairs.
- Independence within Pairs: Each pair’s observations should be independent of other pairs.
- Symmetry in Distribution: The test assumes that the probability of changes in both directions is equal under the null hypothesis.
9. Hypothesis of the McNemar’s Test
McNemar’s Test involves a null and an alternative hypothesis.
- Null hypothesis (H0): there is no difference in the proportions of discordant pairs.
- Alternative hypothesis (H1): there is a significant difference in the proportions of discordant pairs.
In other words, the null hypothesis suggests that the treatment or intervention has no effect on the outcome variable. It serves as the default assumption, indicating no significant change in the paired categorical data. Conversely, the alternative hypothesis implies that the treatment or intervention has a notable effect on the outcome variable. By testing these hypotheses, McNemar’s Test determines whether the observed changes in paired categorical data are statistically significant, guiding researchers in their analysis and interpretation of results.
10. An Example of the McNemar’s Test
Consider a study examining the effectiveness of a new drug in reducing symptoms of a disease. Researchers collect data from patients before and after administering the drug, classifying their symptoms as present or absent. McNemar’s Test can assess whether the drug significantly changes the proportion of patients showing symptoms. By comparing the discordant pairs—those who changed from symptomatic to asymptomatic and vice versa—the test determines the drug’s efficacy.
For instance, suppose researchers find that out of 100 patients, 35 showed symptoms initially, and 25 of these patients no longer exhibited symptoms after treatment, while 10 initially asymptomatic patients developed symptoms. McNemar’s Test would analyse these changes, providing a test statistic and p-value to determine if the observed shifts are statistically significant, thus offering insights into the drug’s effectiveness.
Step by Step: Running the McNemar’s Test in SPSS Statistics
Let’s embark on a step-by-step guide on performing McNemar’s Test using SPSS
- Input Data: Enter the data into SPSS.
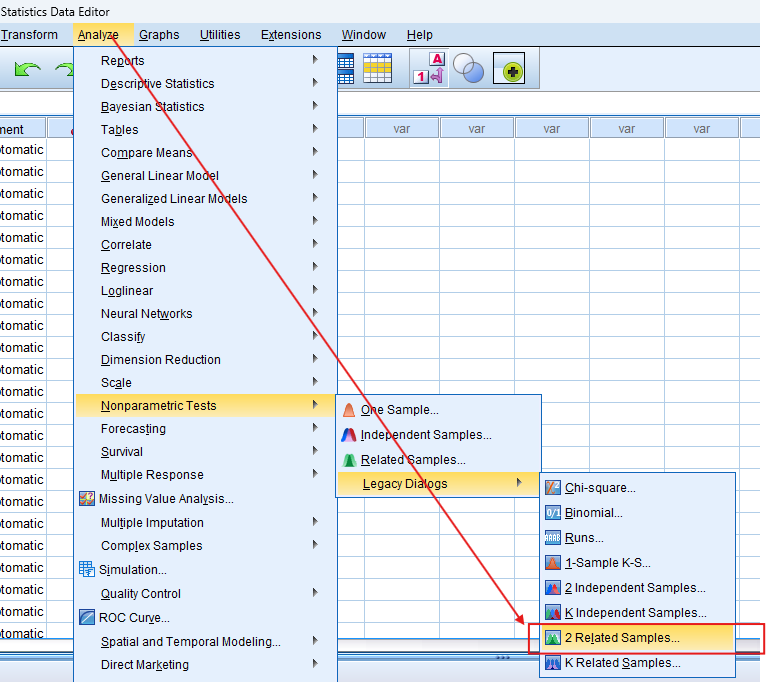
- Select the Test: Navigate to ‘Analyze’ > ‘Nonparametric Tests’ > ‘Legacy Dialogs’ > ‘2 Related Samples’.
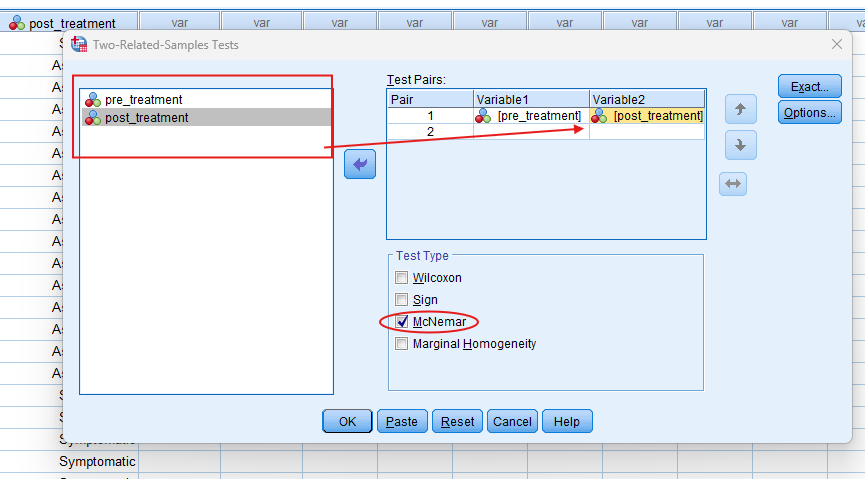
- Choose Variables: Select the variables for pairs
- Run the Test: Click ‘OK’ to run the test.
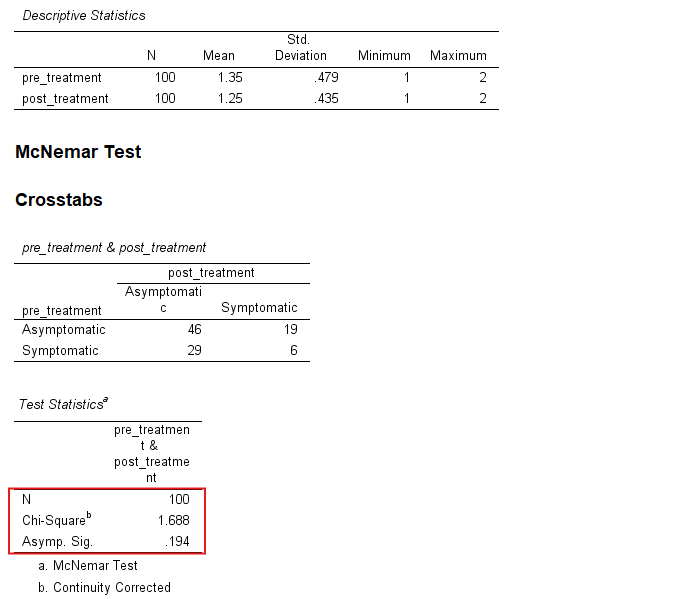
- Interpret Output: SPSS will provide the Chi-Square statistic and p-value. These results indicate whether there is a significant difference between the paired categorical data.
Note: Conducting the McNemar’s Test in SPSS provides a robust foundation for understanding the key features of your data. Always ensure that you consult the documentation corresponding to your SPSS version, as steps might slightly differ based on the software version in use. This guide is tailored for SPSS version 25, and for any variations, it’s recommended to refer to the software’s documentation for accurate and updated instructions.
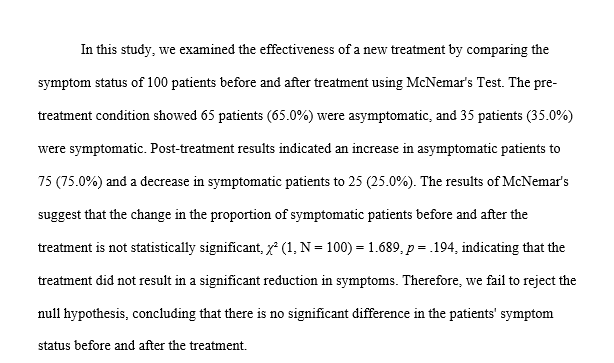
12. SPSS Output for McNemar's Test
13. How to Interpret SPSS Output of McNemar’s Test
Upon completing McNemar’s Test in SPSS, the software provides detailed output, including a test statistic and p-value. The test statistic reflects the number of discordant pairs, indicating changes between the paired samples. A significant p-value (typically less than 0.05) suggests rejecting the null hypothesis, indicating a significant difference in the proportions of discordant pairs.
Additionally, the SPSS output includes tables summarising the frequency of each category, offering a clear view of the data distribution before and after the intervention. By examining these tables alongside the test statistic and p-value, researchers can accurately interpret the results, determining whether the observed changes in their paired categorical data are statistically significant.
14. How to Report Results of McNemar’s Test in APA
Reporting the results of McNemar’s Test in APA (American Psychological Association) format requires a structured presentation. Here’s a step-by-step guide in list format:
- Introduction of the Test: Briefly describe McNemar’s Test and its purpose in your study.
- Sample Description: Provide details about the sample size and characteristics.
- Hypotheses: Clearly state the null and alternative hypotheses.
- Test Statistic and P-Value: Report the test statistic value and corresponding p-value.
- Results Interpretation: Interpret the results, indicating whether the null hypothesis is rejected.
- Tables and Figures: Include relevant tables and figures from the SPSS output.
- Conclusion: Summarise the findings and their implications for your research.
Get Help For Your SPSS Analysis
Embark on a seamless research journey with SPSSAnalysis.com, where our dedicated team provides expert data analysis assistance for students, academicians, and individuals. We ensure your research is elevated with precision. Explore our pages;
- SPSS Help by Subjects Area: Psychology, Sociology, Nursing, Education, Medical, Healthcare, Epidemiology, Marketing
- Dissertation Methodology Help
- Dissertation Data Analysis Help
- Dissertation Results Help
- Pay Someone to Do My Data Analysis
- Hire a Statistician for Dissertation
- Statistics Help for DNP Dissertation
- Pay Someone to Do My Dissertation Statistics
Connect with us at SPSSAnalysis.com to empower your research endeavors and achieve impactful data analysis results. Get a FREE Quote Today!