Kruskal-Wallis H Test in SPSS
Discover the Kruskal-Wallis H Test in SPSS! Learn how to perform, understand SPSS output, and report results in APA style. Check out this simple, easy-to-follow guide below for a quick read!
Struggling with the Kruskal-Wallis H Test in SPSS? We’re here to help. We offer comprehensive assistance to students, covering assignments, dissertations, research, and more. Request Quote Now!

1. Introduction
Understanding statistical tests is crucial for researchers and analysts who aim to interpret data accurately. One such test, the Kruskal-Wallis H Test, serves as a nonparametric alternative to the One-Way ANOVA, allowing comparisons across more than two independent groups. This test becomes especially useful when the data do not meet the assumptions necessary for parametric tests, such as normality and homogeneity of variances. In this blog post, we will explore the Kruskal-Wallis H Test in detail, focusing on its application within SPSS, a powerful statistical software widely used in various fields.
By the end of this article, you will have a clear understanding of how to perform the Kruskal-Wallis H Test in SPSS, interpret the results, and report them accurately. Whether you are new to statistical analysis or looking to refine your skills, this guide aims to provide you with the knowledge needed to effectively use the Kruskal-Wallis H Test in your research. Let’s dive into the essentials of this important nonparametric test and its practical application in SPSS.
2. What is the Kruskal-Wallis H Test in Statistics?
The Kruskal-Wallis H Test is a nonparametric method for testing whether samples originate from the same distribution. It extends the Mann-Whitney U Test to more than two groups, making it suitable for comparing three or more independent groups of ordinal or continuous data that do not necessarily follow a normal distribution. This test ranks all the data from all groups together and then analyses these ranks to determine if there are statistically significant differences between the groups.
Firstly, the Kruskal-Wallis H Test calculates the ranks of all observations across the groups. Secondly, it sums these ranks for each group and uses these sums to compute the test statistic, H. This statistic helps determine whether the differences in rank sums are greater than what would be expected by chance. If the H value is sufficiently large, it suggests that at least one group differs significantly from the others, indicating a potential impact of the independent variable on the dependent variable.
3. What is the Kruskal-Wallis H Test used for?
Researchers use the Kruskal-Wallis H Test to compare more than two independent groups when the assumptions of parametric tests cannot be met. This test is particularly useful in situations where the data are ordinal or when the sample sizes are small and the normality assumption is questionable. For instance, in medical research, it might compare the effectiveness of different treatments across multiple patient groups.
Moreover, the Kruskal-Wallis H Test is frequently applied in social sciences to assess differences in opinions or behaviours across various demographic groups. For example, it could compare the satisfaction levels of customers from different age groups or regions. By utilising this test, researchers can draw meaningful conclusions without relying on the stringent assumptions required by parametric tests, thus ensuring robust and reliable results.
Post Hoc Test for Kruskal-Wallis Test
After performing the Kruskal-Wallis H Test, identifying which specific groups differ requires a post hoc analysis. The Kruskal-Wallis test only reveals that a difference exists but does not specify the groups between which this difference occurs.
To find pairwise group differences, researchers often use the Mann-Whitney U Test as a post hoc procedure. This test compares each pair of groups independently to determine where the significant differences lie. When conducting multiple pairwise comparisons, it is essential to adjust for multiple testing to control the overall Type I error rate. Common adjustments include the Bonferroni correction.
4. What is the Kruskal-Wallis H Test in SPSS?
The Kruskal-Wallis H Test in SPSS allows users to perform nonparametric analysis easily, even with complex datasets. To begin, users input their data into SPSS, ensuring that the dependent variable is ordinal or continuous and that the independent variable consists of three or more independent groups. SPSS then ranks the data and calculates the sum of ranks for each group, ultimately computing the H statistic.
SPSS provides a detailed output that includes the H value, degrees of freedom, and the significance level (p-value). A significant p-value indicates that at least one group differs significantly from the others. SPSS’s user-friendly interface and comprehensive output make it an ideal tool for conducting the Kruskal-Wallis H Test, facilitating accurate and efficient data analysis for researchers and analysts.
5. What is the difference between the One-Way ANOVA and the Kruskal-Wallis H Test?
The One-Way ANOVA and the Kruskal-Wallis H Test both compare differences between three or more groups, but they differ significantly in their assumptions and applications. Firstly, the One-Way ANOVA assumes that the data are normally distributed and that the variances are equal across groups. This parametric test compares the means of the groups to determine if there are significant differences.

In contrast, the Kruskal-Wallis H Test does not require the data to be normally distributed or have equal variances, making it a nonparametric alternative. Instead of comparing means, it evaluates the ranks of the data, making it suitable for ordinal data or continuous data that are not normally distributed. Therefore, researchers choose the Kruskal-Wallis H Test when their data do not meet the stringent assumptions of the One-Way ANOVA, ensuring a more flexible and robust analysis.
6. What Are Other Nonparametric Tests?
- Mann-Whitney U Test: Compares differences between two independent groups when the data are not normally distributed.
- Wilcoxon Signed-Rank Test: Compares two related samples or repeated measurements on a single sample to assess differences in their ranks.
- McNemar Test: Used for paired nominal data to determine changes in proportions.
- Friedman Test: Nonparametric alternative to repeated measures ANOVA, comparing ranks across multiple related groups.
- Sign Test: Evaluates the median of a single sample or compares medians of two related samples.
- Cochran’s Q Test: Extension of the McNemar test for more than two related groups.
- Kendall’s W: Assesses the agreement between raters.
- Binomial Test: Tests the observed proportion against a theoretical proportion.
- Jonckheere-Terpstra Test: Tests for ordered differences among groups.
- Wald-Wolfowitz Runs Test: Evaluates the randomness of a sequence.
- Marginal Homogeneity Test: Assesses changes in proportions in paired categorical data.
- Median Test: Compares the medians of two or more groups.
7. The Assumptions of the Kruskal-Wallis H Test
- Independence: The samples must be independent of each other.
- Ordinal or Continuous Data: The dependent variable should be ordinal or continuous.
- Three or More Groups: The independent variable should consist of three or more independent groups.
- Same Shape Distribution: The distributions of the groups should have the same shape.
8. The Hypothesis of the Kruskal-Wallis H Test
The Kruskal-Wallis H Test operates under two hypotheses.
- The null hypothesis (H0): there are no differences in the distributions of the groups.
- The alternative hypothesis (H1): at least one group distribution differs significantly from the others.
Rejecting the null hypothesis in favour of the alternative indicates that the independent variable has a statistically significant effect on the dependent variable. This finding would suggest that not all groups share the same median, warranting further investigation into the specific differences.
9. An Example of the Kruskal-Wallis H Test
Consider a study aiming to compare the satisfaction levels of customers using three different types of customer service platforms: phone support, email support, and live chat. To perform the Kruskal-Wallis H Test in SPSS, input the satisfaction scores for each platform into the software. Select the Kruskal-Wallis H Test from the nonparametric tests menu and run the analysis.
The SPSS output will include the H statistic and a p-value. If the p-value is less than 0.05, we reject the null hypothesis, indicating a significant difference in satisfaction levels across the three platforms. This result would suggest that the type of customer service platform impacts customer satisfaction, providing valuable insights for improving service delivery.
Step by Step: Running the Kruskal-Wallis H Test in SPSS Statistics
Let’s embark on a step-by-step guide on performing the Kruskal-Wallis H Test using SPSS
- Input Data: Enter the data into SPSS, ensuring the dependent variable (e.g., satisfaction scores) and the independent variable (e.g., customer service platform) are correctly labelled.
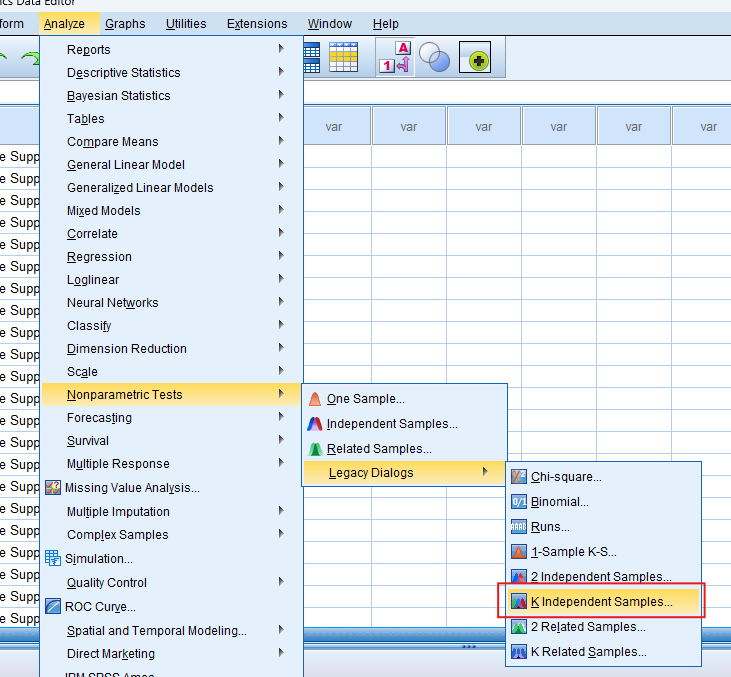
- Select the Test: Navigate to ‘Analyze’ > ‘Nonparametric Tests’ > ‘K Independent Samples’.
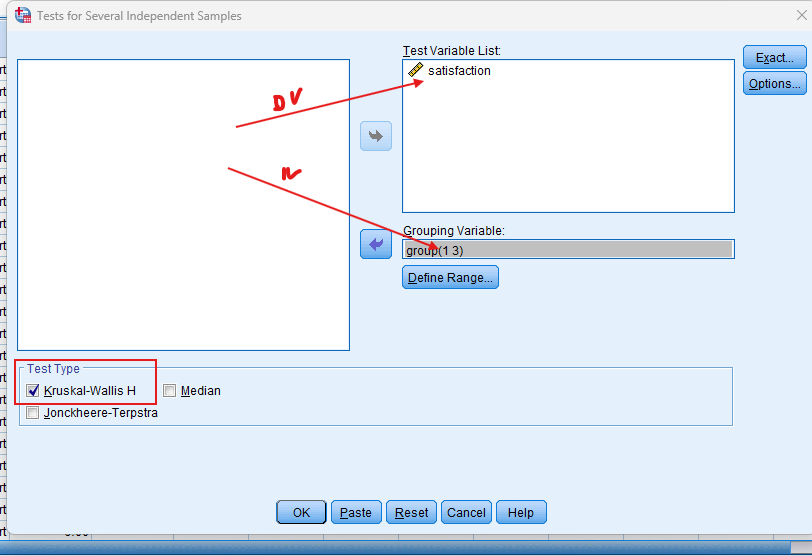
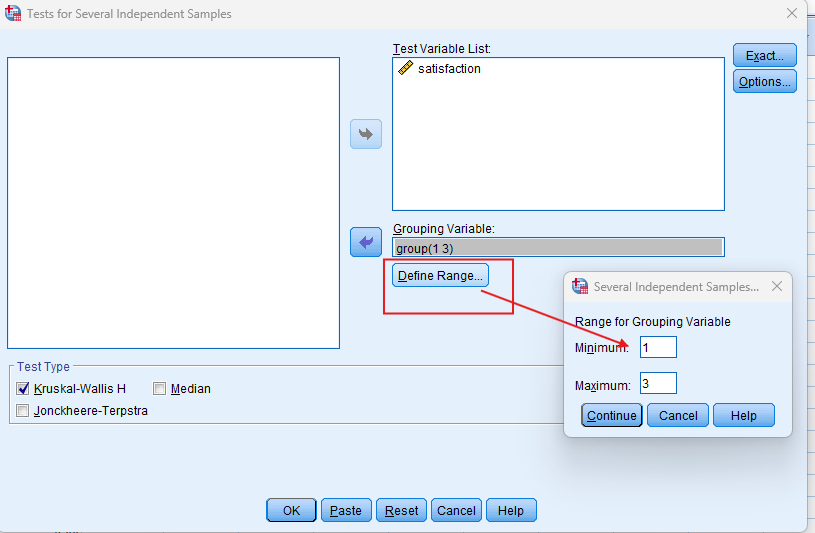
- Choose Variables: Select the dependent variable for ‘Test Variable List’ and the independent variable for ‘Grouping Variable’. Define the groups appropriately.
- Run the Test: Click ‘OK’ to run the Kruskal-Wallis H Test.
5. Interpret Output: SPSS will provide the H statistic, degrees of freedom, and p-value. A p-value less than 0.05 indicates a significant difference between the groups
Note: Conducting the Kruskal-Wallis H Test in SPSS provides a robust foundation for understanding the key features of your data. Always ensure that you consult the documentation corresponding to your SPSS version, as steps might slightly differ based on the software version in use. This guide is tailored for SPSS version 25, and for any variations, it’s recommended to refer to the software’s documentation for accurate and updated instructions.
11. SPSS Output for Kruskal-Wallis H Test

12. How to Interpret SPSS Output of Kruskal-Wallis H Test
The SPSS output for the Kruskal-Wallis Test typically includes several key tables, including Descriptive Statistics, Ranks, Test Statistics Tables
- The ranks table displays the mean ranks for each group, helping to understand the direction of any differences.
- The Test Statistics table provides the H statistic, Z score, and p-value. The p-value determines the significance of the results.
If the p-value is less than 0.05, it suggests a significant difference in the distributions of the at least groups. Researchers should then examine the mean ranks to understand which group tends to have higher or lower values. Additionally, the H score offers insight into the magnitude of the difference between groups. Together, these elements enable a comprehensive interpretation of the test results.
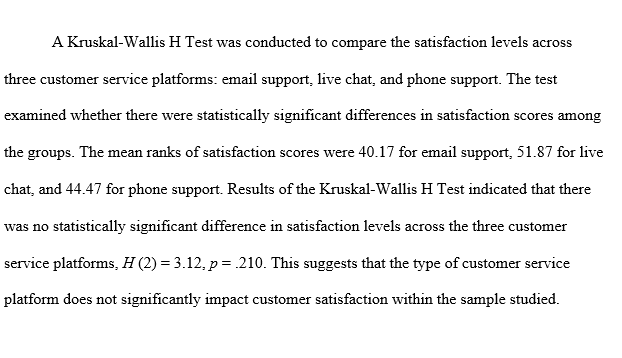
13. How to Report Results of the Kruskal-Wallis H Test in APA
Reporting the results of Kruskal-Wallis in APA (American Psychological Association) format requires a structured presentation. Here’s a step-by-step guide in list format:
- Introduction: Describe the purpose of the analysis, such as comparing satisfaction levels across different customer service platforms.
- Method: Detail the data collection process and the variables involved. Specify the dependent variable and the independent variable with its three or more groups.
- Results: Present the key statistics from the SPSS output, including the H statistic, degrees of freedom, and the p-value.
- Figures and Tables: Include relevant SPSS output tables, such as the ‘Ranks’ and ‘Test Statistics’ tables. Ensure they are properly labelled and referenced in the text.
- Discussion: Interpret the results, highlighting the significance of the findings. Explain what the significant difference means in the context of the research question.
- Conclusion: Summarise the main points of the analysis. Reinforce the finding that there was a significant difference between the groups. Suggest potential areas for further research, such as examining other factors that might influence satisfaction levels or using larger sample sizes for increased power.
Get Help For Your SPSS Analysis
Embark on a seamless research journey with SPSSAnalysis.com, where our dedicated team provides expert data analysis assistance for students, academicians, and individuals. We ensure your research is elevated with precision. Explore our pages;
- SPSS Help by Subjects Area: Psychology, Sociology, Nursing, Education, Medical, Healthcare, Epidemiology, Marketing
- Dissertation Methodology Help
- Dissertation Data Analysis Help
- Dissertation Results Help
- Pay Someone to Do My Data Analysis
- Hire a Statistician for Dissertation
- Statistics Help for DNP Dissertation
- Pay Someone to Do My Dissertation Statistics
Connect with us at SPSSAnalysis.com to empower your research endeavors and achieve impactful data analysis results. Get a FREE Quote Today!