Jonckheere-Terpstra Test
Discover the Jonckheere-Terpstra Test in SPSS! Learn how to perform, understand SPSS output, and report results in APA style. Check out this simple, easy-to-follow guide below for a quick read!
Struggling with the Jonckheere-Terpstra Test in SPSS? We’re here to help. We offer comprehensive assistance to students, covering assignments, dissertations, research, and more. Request Quote Now!
1. Introduction
The Jonckheere-Terpstra Test in SPSS provides a robust method for analysing ordered differences among multiple groups. As a non-parametric statistical test, it specifically addresses the need to evaluate trends in ordinal data, making it ideal for researchers who work with ranked data or small sample sizes. By using the Jonckheere-Terpstra Test in SPSS, you can determine if there is a significant trend across your groups, offering insights that might be missed with other statistical methods.
In this blog post, we will delve into the Jonckheere-Terpstra Test, exploring its purpose, how it differs from other tests, and the specific steps to perform it using SPSS. Whether you are a seasoned statistician or a student new to non-parametric tests, this guide aims to provide a comprehensive overview. Let’s start by understanding what the Jonckheere-Terpstra Test entails and how it can be used effectively in your research.
2. Jonckheere-Terpstra Test in Statistics
The Jonckheere-Terpstra Test is a non-parametric statistical test designed to identify trends across ordered groups. Unlike parametric tests, which assume a normal distribution of data, the Jonckheere-Terpstra Test makes no such assumptions, making it particularly useful for analysing ordinal data or data that do not meet parametric assumptions. This test is an extension of the Mann-Whitney U test, allowing for more than two groups while maintaining its focus on detecting ordered differences.
In statistics, the Jonckheere-Terpstra Test is invaluable when you need to determine whether there is a consistent trend in your data. For example, if you are studying the effectiveness of different doses of a drug, this test can help you ascertain if higher doses consistently lead to better outcomes. Its ability to handle ordered alternatives makes it a powerful tool for researchers looking to explore trends within their data.
3. What is the Jonckheere-Terpstra Test used for?
Researchers use the Jonckheere-Terpstra Test to detect trends across multiple groups, particularly when dealing with ordinal data. This test is essential in situations where the data does not meet the assumptions required for parametric tests, such as the normal distribution. By using this test, researchers can identify whether there is a statistically significant trend in their data, such as increasing or decreasing values across ordered categories.
In practical terms, the Jonckheere-Terpstra Test is commonly used in fields like medicine, psychology, and social sciences. For instance, a medical researcher might use this test to evaluate the effectiveness of a new treatment across different dosage levels. Similarly, a psychologist could employ it to study behavioural changes across various age groups. Its flexibility and robustness make it a preferred choice for analysing trends in non-parametric data.
4. Kruskal Wallis Test vs Jonckheere-Terpstra Test
Firstly, the Kruskal-Wallis test and the Jonckheere-Terpstra test both serve as non-parametric alternatives to ANOVA, but they cater to different research needs. The Kruskal-Wallis test assesses whether there are significant differences between the medians of three or more independent groups without considering any particular order. It is ideal for situations where the groups are independent, and the interest lies in detecting any significant differences among them.
On the other hand, the Jonckheere-Terpstra test specifically tests for an ordered alternative hypothesis. This means it is used when there is a logical or natural ordering to the groups, and the research hypothesis suggests a trend or direction. For example, if you hypothesise that higher doses of a medication lead to progressively better outcomes, the Jonckheere-Terpstra test would be more appropriate. Thus, while both tests are non-parametric and suitable for ordinal data, they cater to different types of research questions.
5. What Are Other Nonparametric Tests?
- Mann-Whitney U Test: Compares differences between two independent groups when the data are not normally distributed.
- Kruskal-Wallis Test: Extends the Mann-Whitney U Test to more than two groups, assessing rank differences—nonparametric alternative to One-Way ANOVA Test.
- Wilcoxon Signed-Rank Test: Compares two related samples or repeated measurements on a single sample to assess differences in their ranks.
- McNemar Test: Used for paired nominal data to determine changes in proportions.
- Friedman Test: Nonparametric alternative to repeated measures ANOVA, comparing ranks across multiple related groups.
- Sign Test: Evaluates the median of a single sample or compares medians of two related samples.
- Cochran’s Q Test: Extension of the McNemar test for more than two related groups.
- Kendall’s W: Assesses the agreement between raters.
- Binomial Test: Tests the observed proportion against a theoretical proportion.
- Wald-Wolfowitz Runs Test: Evaluates the randomness of a sequence.
- Marginal Homogeneity Test: Assesses changes in proportions in paired categorical data.
- Median Test: Compares the medians of two or more groups.
6. Assumptions of the Jonckheere-Terpstra Test
The Jonckheere-Terpstra Test in SPSS operates under several assumptions, ensuring the validity of its results. These assumptions include:
- Independence of Observations: Each group’s observations must be independent of the others.
- Ordinal Scale: The data should be at least ordinal, meaning it should be possible to rank the data.
- Homogeneity of Variances: The variances among groups should be roughly equal.
- Ordered Groups: There should be a logical or natural ordering to the groups being compared.
- No Ties in Data: The test assumes no ties in the ranks among the groups.
Meeting these assumptions is crucial for the accurate application and interpretation of the Jonckheere-Terpstra Test, ensuring the robustness of your statistical analysis.
7. Hypothesis of the Jonckheere-Terpstra Test
The Jonckheere-Terpstra Test evaluates a specific type of hypothesis related to trends across ordered groups.
- The null hypothesis (H0) posits that there is no trend or ordered difference among the groups.
- The alternative hypothesis (H1) suggests a specific direction or trend among the groups.
For example, in a study assessing the efficacy of increasing doses of a drug, the alternative hypothesis might state that higher doses lead to better outcomes. Rejecting the null hypothesis in favour of the alternative implies that the observed trend is statistically significant, supporting the hypothesis that there is a consistent order to the differences among the groups.
8. An Example of the Jonckheere-Terpstra Test
Consider a study aiming to determine whether a new educational programme improves student performance across three different levels of difficulty. Researchers gather performance data from students who underwent the programme at the beginner, intermediate, and advanced levels. To analyse whether there is a trend in performance improvement with increasing levels of difficulty, the Jonckheere-Terpstra Test would be an appropriate choice.
Using the Jonckheere-Terpstra Test in SPSS, researchers can input the performance data for each group. The test will then assess whether there is a statistically significant trend in student performance across the ordered levels. If the test results show a significant trend, it would suggest that the educational programme effectively enhances student performance progressively from beginner to advanced levels, thus providing valuable insights for further curriculum development.

Step by Step: Running the Jonckheere-Terpstra Test in SPSS Statistics
Let’s embark on a step-by-step guide on performing the Jonckheere-Terpstra Test using SPSS
- Input Data: Enter your repeated measures data into separate columns in SPSS.
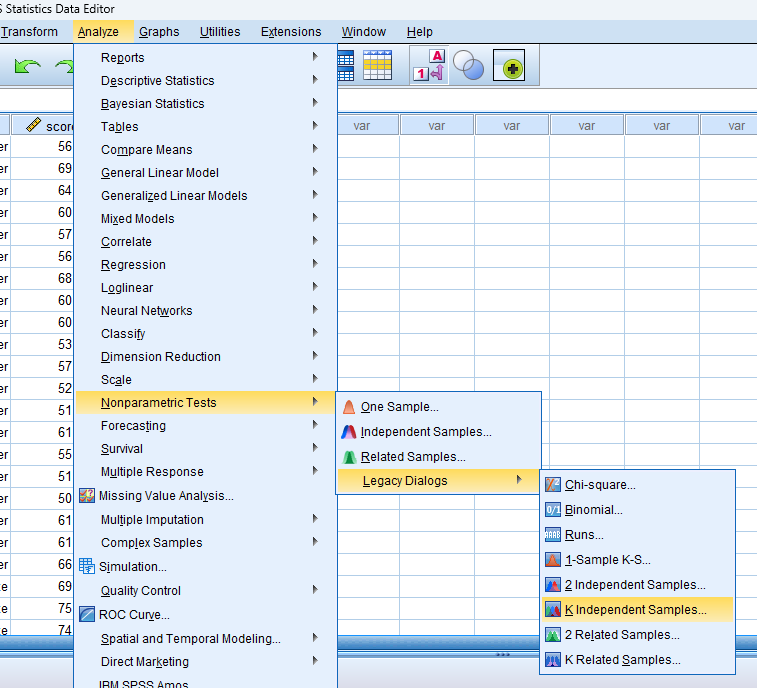
- Select Test: Navigate to `Analyze` > `Nonparametric Tests` > “Legacy Dialogs” > “K Independent Samples.”
- Choose Variables: In the dialogue box that appears, move your test variable into the “Test Variable List” and your grouping variable into the “Grouping Variable” field. Define your groups by specifying the minimum and maximum values. Then, select “Jonckheere-Terpstra” under the “Test Type” options.
- Run Test: Click `OK` to run the test.
- Review Output: SPSS will generate output tables with the test statistics and significance levels.
Note: Conducting the Jonckheere-Terpstra Test in SPSS provides a robust foundation for understanding the key features of your data. Always ensure that you consult the documentation corresponding to your SPSS version, as steps might slightly differ based on the software version in use. This guide is tailored for SPSS version 25, and for any variations, it’s recommended to refer to the software’s documentation for accurate and updated instructions.
10. SPSS Output for Jonckheere-Terpstra Test
11. How to Interpret SPSS Output of Jonckheere-Terpstra Test
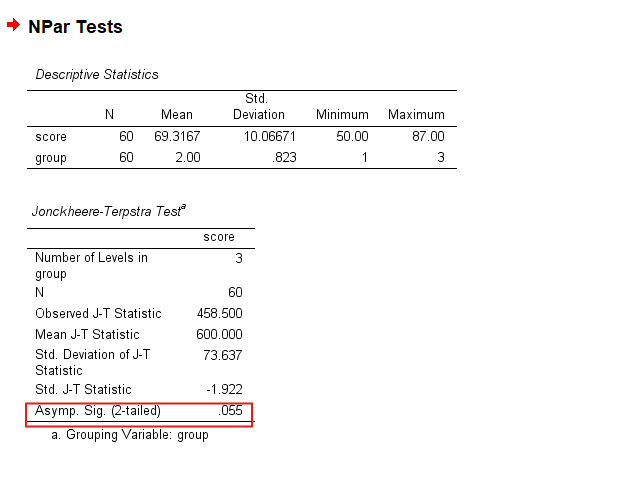
Interpreting the SPSS output of the Jonckheere-Terpstra Test requires examining several key tables. Firstly, look at the “Test Statistics” table, which provides the Jonckheere-Terpstra statistic (J) and its associated p-value. The p-value determines the statistical significance of your results. If the p-value is less than the chosen alpha level (commonly 0.05), you reject the null hypothesis, indicating a significant trend among your groups.
Additionally, review the “Descriptive Statistics” table, which offers insights into the data distribution across groups. This table includes the mean ranks for each group, allowing you to observe the trend visually. By combining these statistical results with the descriptive data, you can comprehensively interpret the significance and direction of the trends within your dataset, providing a clear understanding of your findings.
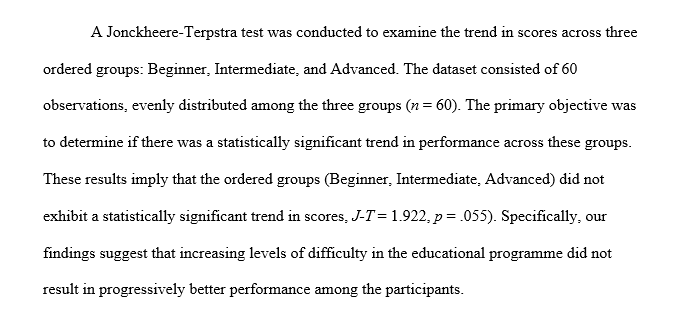
12. How to Report Results of the Jonckheere-Terpstra Test in APA
When reporting the results of the Jonckheere-Terpstra Test in APA format, follow these guidelines:
- Introduction of the Test: Clearly state the purpose of the Jonckheere-Terpstra Test and its relevance to your study.
- Hypothesis: Outline the null and alternative hypotheses.
- Data Description: Provide a brief description of the data and how it was collected.
- Test Results: Present the Jonckheere-Terpstra statistic (J), degrees of freedom (if applicable), and the p-value.
- Interpretation: Explain the significance of the results and whether they support the alternative hypothesis.
- Conclusion: Summarise the findings and their implications for your research.
Get Help For Your SPSS Analysis
Embark on a seamless research journey with SPSSAnalysis.com, where our dedicated team provides expert data analysis assistance for students, academicians, and individuals. We ensure your research is elevated with precision. Explore our pages;
- SPSS Help by Subjects Area: Psychology, Sociology, Nursing, Education, Medical, Healthcare, Epidemiology, Marketing
- Dissertation Methodology Help
- Dissertation Data Analysis Help
- Dissertation Results Help
- Pay Someone to Do My Data Analysis
- Hire a Statistician for Dissertation
- Statistics Help for DNP Dissertation
- Pay Someone to Do My Dissertation Statistics
Connect with us at SPSSAnalysis.com to empower your research endeavors and achieve impactful data analysis results. Get a FREE Quote Today!