Friedman Test in SPSS
Discover the Friedman Test in SPSS! Learn how to perform, understand SPSS output, and report results in APA style. Check out this simple, easy-to-follow guide below for a quick read!
Struggling with Friedman’s Test in SPSS? We’re here to help. We offer comprehensive assistance to students, covering assignments, dissertations, research, and more. Request Quote Now!
1. Introduction
The Friedman test in SPSS is an essential tool for researchers dealing with non-parametric data and repeated measures. This statistical test evaluates differences across multiple related groups, making it invaluable in various fields, including psychology, education, and medical research. The Friedman test ranks the data and assesses whether the ranks differ significantly across groups.
In this blog post, we will delve into the intricacies of the Friedman test, exploring its purpose, applications, and how it compares to other non-parametric tests. We will also provide a comprehensive guide on performing the test in SPSS, interpreting the results, and reporting them according to APA guidelines. By the end, you will have a thorough understanding of the Friedman test and its practical implementation.
2. Friedman Test in Statistics
The Friedman test is a non-parametric test used to detect differences in treatments across multiple test attempts. It is an extension of the sign test and is applicable when the same subjects are involved in each group. Unlike parametric tests, the Friedman test does not assume a normal distribution, making it suitable for ordinal data or when the assumptions of normality are violated.
First developed by Milton Friedman in 1937, this test ranks the data from each group and evaluates these ranks for statistically significant differences. It operates under the null hypothesis that the distributions of the ranks are the same across groups. The Friedman test is particularly useful in experimental designs involving repeated measures or matched subjects.
3. What is the Friedman Test used for?
Researchers use the Friedman test primarily to analyse data from repeated measures designs. This test is ideal for scenarios where the same subjects undergo different treatments, or measurements are taken under various conditions. It is particularly useful in fields like psychology, where experiments often involve repeated measures on the same subjects.
For example, in clinical trials, the Friedman test can compare the effectiveness of several treatments on the same group of patients. Similarly, in educational research, it might evaluate the impact of different teaching methods on student performance. The test’s ability to handle non-parametric data and repeated measures makes it a versatile tool for many research scenarios.
4. Repeated Measures ANOVA Vs. Friedman Test
The Repeated Measures ANOVA and the Friedman Test both analyse data from repeated measures designs, but they differ in their assumptions and applications. The Repeated Measures ANOVA assumes normally distributed data and sphericity, making it suitable for interval or ratio data. In contrast, the Friedman Test does not assume normality and is used for ordinal data or when parametric assumptions are not met.
Furthermore, the Repeated Measures ANOVA evaluates mean differences across groups, while the Friedman Test ranks the data and assesses rank differences. This distinction makes the Friedman Test more robust against outliers and skewed distributions. Researchers often choose the Friedman Test when the data do not meet the stringent assumptions required for Repeated Measures ANOVA.
5. When to use: Friedman Test, Cochran’s Q Test, Kendall’s W
- Friedman Test: Use the Friedman Test when you have repeated measures data involving more than two related groups. This test evaluates differences in treatments across multiple test attempts, making it ideal for situations where the same subjects are measured under different conditions or treatments. For example, a researcher might use the Friedman Test to compare the effectiveness of three different diets on weight loss among the same group of participants.
- Cochran’s Q Test: Apply Cochran’s Q Test when dealing with dichotomous (binary) data collected from the same subjects under different conditions. This test extends McNemar’s Test to more than two related groups. It is particularly useful for testing whether the proportions of a binary outcome differ across multiple related groups. For instance, a medical researcher might use Cochran’s Q Test to determine if the response rates to a treatment differ across three different time points in the same group of patients.
- Kendall’s W: Kendall’s W, or Kendall’s Coefficient of Concordance, measures the agreement among raters or the consistency of rankings assigned by multiple judges. Use Kendall’s W when you want to assess the degree of association between rankings of different judges or measurements. This test is beneficial in scenarios where you need to determine the consistency of subjective ratings. For example, Kendall’s W can help evaluate the agreement among judges in a talent competition or the consistency of ratings assigned to research papers by different reviewers.
Each of these tests serves a unique purpose in statistical analysis. The Friedman Test is ideal for comparing related groups with ordinal or continuous data, Cochran’s Q Test is perfect for binary outcomes in related samples, and Kendall’s W assesses agreement among multiple raters. Understanding when to use each test ensures accurate and meaningful analysis of your data.
6. What Are Other Nonparametric Tests?
- Mann-Whitney U Test: Compares differences between two independent groups when the data are not normally distributed.
- Kruskal-Wallis Test: Extends the Mann-Whitney U Test to more than two groups, assessing rank differences—nonparametric alternative to One-Way ANOVA Test.
- Wilcoxon Signed-Rank Test: Compares two related samples or repeated measurements on a single sample to assess differences in their ranks.
- McNemar Test: Used for paired nominal data to determine changes in proportions.
- Sign Test: Evaluates the median of a single sample or compares medians of two related samples.
- Cochran’s Q Test: Extension of the McNemar test for more than two related groups.
- Kendall’s W: Assesses the agreement between raters.
- Binomial Test: Tests the observed proportion against a theoretical proportion.
- Jonckheere-Terpstra Test: Tests for ordered differences among groups.
- Wald-Wolfowitz Runs Test: Evaluates the randomness of a sequence.
- Marginal Homogeneity Test: Assesses changes in proportions in paired categorical data.
- Median Test: Compares the medians of two or more groups.
7. The Assumptions of the Friedman Test
- Paired or Matched Data: The same subjects should be involved in each group or condition.
- Ordinal or Continuous Data: The test requires ordinal or continuous data.
- Related Groups: The groups should be related, meaning the data come from repeated measures or matched subjects.
- No Assumption of Normality: The test does not assume a normal distribution of the data.
These assumptions ensure the validity of the Friedman Test results. Violating these assumptions can lead to inaccurate conclusions, so it is crucial to verify them before performing the test.
8. The Hypothesis of the Friedman Test
In the Friedman Test, the hypotheses focus on the ranks of the data across multiple groups.
- The null hypothesis (H0): the distributions of the ranks are the same across all groups.
- The alternative hypothesis (H1): at least one group’s rank distribution differs significantly from the others.
This implies no significant difference in the treatments or conditions being compared.
Testing these hypotheses helps determine whether the observed differences in ranks are statistically significant, guiding researchers in interpreting their data.
9. An Example of the Friedman Test
Consider a study assessing the impact of three different diets on weight loss. Researchers collect weight measurements from the same group of participants after each diet. To analyse the data, they input the measurements into SPSS, ensuring that each participant’s data are matched correctly.
Running the Friedman Test in SPSS, researchers rank the weight measurements from each diet and evaluate the differences in these ranks. The output reveals whether the diets produce significantly different effects on weight loss. This example illustrates the test’s practical application, providing valuable insights into the effectiveness of various treatments.

Step by Step: Running the Friedman Test in SPSS Statistics
Let’s embark on a step-by-step guide on performing the Friedman Test using SPSS
- Input Data: Enter your repeated measures data into separate columns in SPSS.
- Select Test: Navigate to `Analyze` > `Nonparametric Tests` > `K Related Samples`.
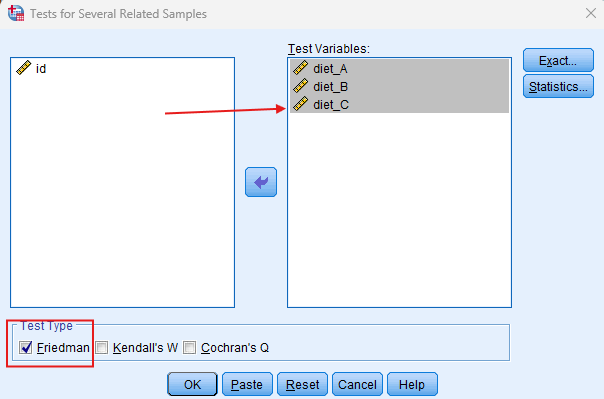
- Choose Variables: Select the variables representing your repeated measures.
- Run Test: Click `OK` to run the test.
- Review Output: SPSS will generate output tables with the test statistics and significance levels.
Note: Conducting the Friedman Test in SPSS provides a robust foundation for understanding the key features of your data. Always ensure that you consult the documentation corresponding to your SPSS version, as steps might slightly differ based on the software version in use. This guide is tailored for SPSS version 25, and for any variations, it’s recommended to refer to the software’s documentation for accurate and updated instructions.
11. SPSS Output for Friedman Test
12. How to Interpret SPSS Output of Friedman Test
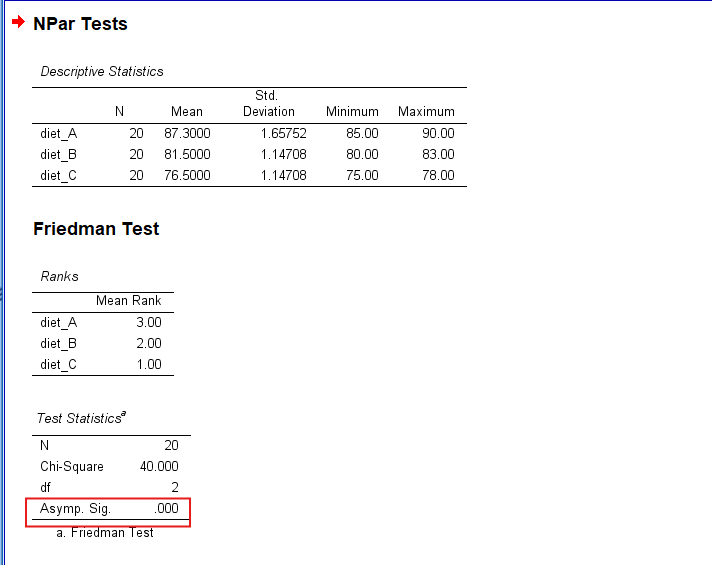
Upon running the Friedman Test in SPSS, you will receive output tables displaying key statistics. The `Test Statistics` table includes the Chi-square value, degrees of freedom, and the asymptotic significance (p-value). A p-value less than 0.05 typically indicates a significant difference across the related groups.
Additionally, the `Descriptive Statistics` table provides mean ranks for each group, helping identify which groups differ from the others. Interpreting these tables helps determine the direction and significance of the observed differences, guiding researchers in drawing meaningful conclusions from their data.
13. How to Report Results of the Friedman Test in APA
Reporting the results of the Friedman Test in APA (American Psychological Association) format requires a structured presentation. Here’s a step-by-step guide in list format:
- Introduction: Begin by describing the purpose of the analysis. Briefly describe the repeated measures data and context.
- Method: Detail the data collection process and the variables involved. Specify that the test ranks all values from both groups combined, then calculates the sum of the ranks for each group to determine the Chi-square statistic.
- Results: Present the key statistics from the SPSS output. Include the Chi-square value, degrees of freedom, and p-value.
- Discussion: Interpret the results, highlighting the significance of the findings. Explain what the lack of a significant difference means in the context of the research question.
- Conclusion: Summarise the main points of the analysis. Explain the implications of your findings within the context of your study.

Get Help For Your SPSS Analysis
Embark on a seamless research journey with SPSSAnalysis.com, where our dedicated team provides expert data analysis assistance for students, academicians, and individuals. We ensure your research is elevated with precision. Explore our pages;
- SPSS Help by Subjects Area: Psychology, Sociology, Nursing, Education, Medical, Healthcare, Epidemiology, Marketing
- Dissertation Methodology Help
- Dissertation Data Analysis Help
- Dissertation Results Help
- Pay Someone to Do My Data Analysis
- Hire a Statistician for Dissertation
- Statistics Help for DNP Dissertation
- Pay Someone to Do My Dissertation Statistics
Connect with us at SPSSAnalysis.com to empower your research endeavors and achieve impactful data analysis results. Get a FREE Quote Today!