Chi-Square Test for Homogeneity
Discover the Chi-Square Test for Homogeneity in SPSS! Learn how to perform, understand SPSS output, and report results in APA style. Check out this simple, easy-to-follow guide below for a quick read!
Struggling with the Chi-Squared Test in SPSS? We’re here to help. We offer comprehensive assistance to students, covering assignments, dissertations, research, and more. Request Quote Now!
1. Introduction
The Chi-Square Test for Homogeneity is a vital statistical method used to determine whether two or more populations share the same distribution of a categorical variable. This test is similar to the Chi-Square Test of Independence but focuses on whether different populations have the same proportions across a set of categories. Researchers and data analysts frequently use this test in various fields, including healthcare, marketing, and social sciences, to compare populations.
In this blog post, we will discuss the fundamentals of the Chi-Square Test for Homogeneity, explore its assumptions and hypotheses, and walk through the steps of performing this test in SPSS. By the end of this guide, you will understand how to conduct and interpret the results of the Chi-Square Test for Homogeneity.
2. What is the Chi-Square Test for Homogeneity in Statistics?
The Chi-Square Test for Homogeneity is a statistical test that examines whether two or more independent populations have the same distribution of a categorical variable. Unlike the Chi-Square Test of Independence, which looks at the relationship between two variables, the homogeneity test compares the proportions of different populations. The test uses observed and expected frequencies from each population to calculate a Chi-Square statistic, which indicates whether the proportions are significantly different.
Firstly, researchers use this test when they want to compare different groups or populations based on a specific categorical variable. Secondly, by calculating the Chi-Square statistic and comparing it to a critical value, researchers can determine if the observed differences between populations are statistically significant.
Several key terms relate to the Chi-Square Test for Homogeneity :
- Cross Tabulation: A method of summarising categorical data by displaying the frequency distribution of the variables in a matrix format.
- Contingency Table: A table used in the Chi-Square test that shows the observed frequency counts for each combination of the variables.
- Effect Sizes for Chi-Square: Effect size measures include Phi (φ), Cramér’s V, Gamma, Somers’d, and Kendall’s tau-b. These effect sizes help quantify the strength of the association.
Effect Size Chi-square Test
- Phi (φ): Phi is used when both variables in the contingency table are dichotomous (2×2 table). It measures the degree of association between two binary variables, with values ranging from -1 to +1, where values closer to ±1 indicate a stronger association.
- Cramér’s V: Cramér’s V is a generalisation of Phi and is used when the contingency table is larger than 2×2. It adjusts Phi for the size of the table and also ranges from 0 to 1, with values closer to 1 indicating a stronger association.
- Gamma: Gamma measures the strength and direction of association between two ordinal variables. It ranges from -1 to +1, where positive values indicate a positive relationship and negative values indicate an inverse relationship.
- Somers’ d: Somers’ d is an asymmetrical measure used when one variable is considered dependent. It measures the strength and direction of association between two ordinal variables, and like Gamma, it ranges from -1 to +1.
- Kendall’s tau-b: This measure is used for square contingency tables where both variables are ordinal. It adjusts for ties in the data and provides an indication of the strength and direction of the relationship between the two variables.
- Kendall’s tau-c: Similar to tau-b but used for non-square tables, tau-c adjusts for different numbers of categories in each variable.
3. What is the Formula for the Chi-Square Test?
The formula for the Chi-Square Test for Homogeneity is:
χ2=∑(O−E)2E\chi^2 = \sum \frac{(O – E)^2}{E}
Where:
- O represents the observed frequency for each category.
- E represents the expected frequency for each category, assuming no association between the variables.
The formula calculates how far the observed counts deviate from the expected counts under the null hypothesis of no association. The test result is compared against the Chi-Squared distribution to determine statistical significance.
4. What is the Chi-Square Test used for?
The Chi-Square Test for Homogeneity is commonly used in research when the goal is to compare the distributions of a categorical variable across multiple populations. For example, in healthcare, researchers might want to determine whether the distribution of disease incidence differs across different regions. Similarly, marketers may want to compare customer preferences across different age groups to identify whether product preference is homogeneous across demographics.
This test is highly useful in fields where comparing categorical data between groups is essential. By identifying whether the proportions of categories are consistent across populations, researchers can make data-driven decisions and identify trends within and between groups.
5. Explain Differences among Chi-Square Tests of Independence, Goodness Fit, Association, Homogeneity, and Fisher’s Exact
- Chi-Square Test for Association: Determines if two categorical variables are associated or independent by comparing observed and expected frequencies in a contingency table.
- Chi-Square Test of Independence: Similar to the test for association, it assesses whether two variables are independent. The key difference lies in the context of the research question, with independence tests often focusing on whether the distribution of one variable is unaffected by the other.
- Chi-Square Goodness-of-Fit Test: Compares observed frequencies of a single categorical variable to a theoretically expected distribution. Researchers use it to determine if a sample fits a specific distribution.
- Chi-Square Test of Homogeneity: Tests whether two or more groups are homogeneous in terms of the distribution of a categorical variable. This test is used to compare the proportions across different populations.
- Fisher’s Exact Test: Fisher’s Exact Test is an alternative to the Chi-Squared test for 2×2 contingency tables, especially when sample sizes are small or when expected frequencies are less than 5. Unlike the Chi-Squared test, Fisher’s Exact Test provides an exact p-value, making it more accurate when dealing with small or sparse data. It is particularly useful when the assumptions of the Chi-Squared test are not met.
6. What are the Assumptions of the Chi-Square Test?
Before performing the Chi-Square Test for Homogeneity, the following assumptions must be satisfied:
- The variables must be categorical.
- The observations must be independent of one another.
- The expected frequency in each cell of the contingency table should be 5 or greater.
- The sample size should be sufficiently large to ensure reliable results.
- The data should not contain overlapping categories.
7. What is the Hypothesis of the Chi-Square Test?
The Chi-Square Test for Homogeneity involves two hypotheses:
- Null Hypothesis (H₀): The distribution of the categorical variable is the same across all populations. This means that the proportions in each category are equal across groups.
- Alternative Hypothesis (H₁): The distribution of the categorical variable is not the same across all populations. This means that at least one group has a different proportion of categories compared to the others.
Rejecting the null hypothesis suggests that the categorical distributions differ between the populations being compared.
8. An Example of the Chi-Square Test for Association
Imagine a study comparing the voting preferences of three different age groups: young adults (18-29), middle-aged adults (30-49), and older adults (50+). The researcher collects data on the preferred political party for each individual within these groups, creating a contingency table that displays the number of individuals in each age group who favour a specific party.
To test whether the distribution of political party preference is the same across the three age groups, the researcher uses the Chi-Square Test for Homogeneity. By comparing the observed and expected frequencies of preferences across the groups, the researcher can determine if voting preferences are homogeneous or vary significantly across age groups.
9. How to Perform Chi Square Test for Homogeneity in SPSS
Step by Step: Running Chi-Square Test for Homogeneity in SPSS Statistics
Let’s embark on a step-by-step guide on performing the Chi-Square Test for Homogeneity using SPSS
- STEP: Load Data into SPSS
Commence by launching SPSS and loading your dataset, which should encompass the variables of interest – a categorical independent variable. If your data is not already in SPSS format, you can import it by navigating to File > Open > Data and selecting your data file.
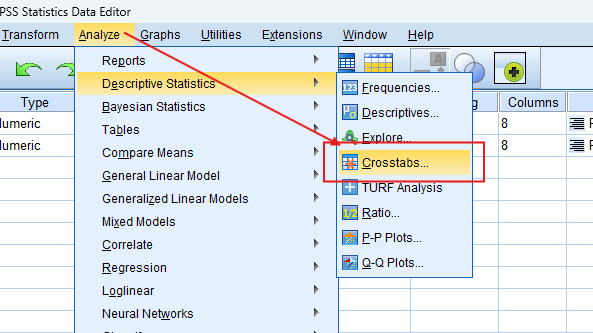
- STEP: Access the Analyze Menu
In the top menu, click on Analyse > Descriptive Statistics > Crosstabs.
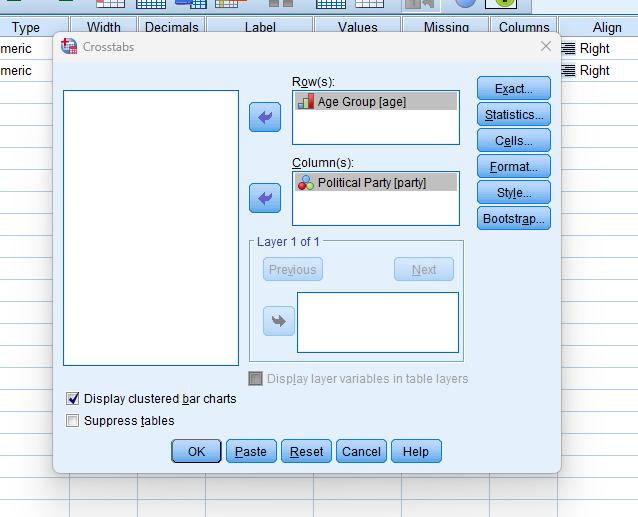
- STEP: Specify Variables
- Assign one variable to the row and the other to the column in the crosstabs dialogue box.
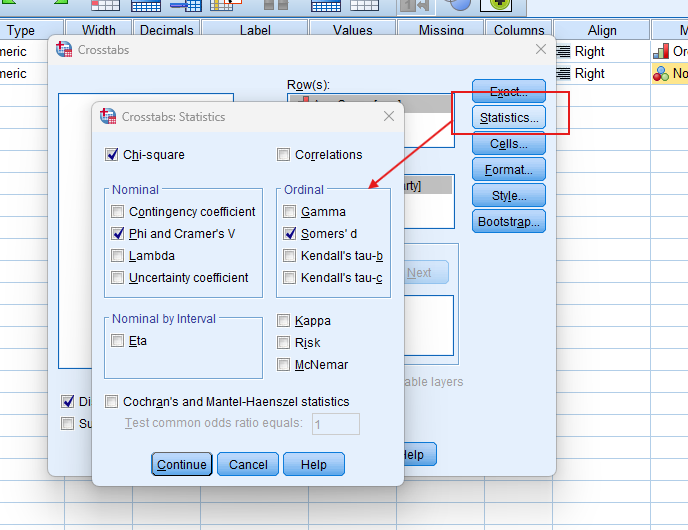
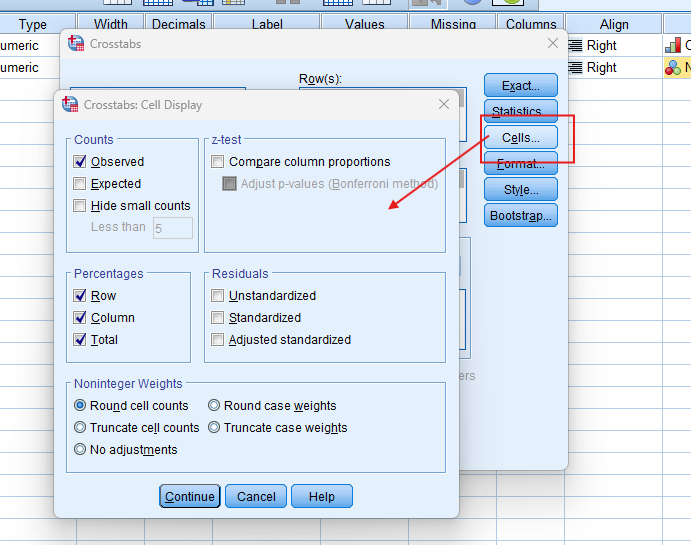
- Choose Chi-Squared: Click on the Statistics button, and select Chi-square to include the test in your output.
- Check Expected Counts: Enable the expected counts to compare observed and expected values.
- Check Effect Size: Choose the most appropriate effect size from the menu.
- STEP: Generate SPSS Output
- Click ‘OK’ after selecting your variables and method. SPSS will run the analysis and generate output tables and survival curves.
Note: Conducting the Chi-Square Test for Homogeneity in SPSS provides a robust foundation for understanding the key features of your data. Always ensure that you consult the documentation corresponding to your SPSS version, as steps might slightly differ based on the software version in use. This guide is tailored for SPSS version 25, and for any variations, it’s recommended to refer to the software’s documentation for accurate and updated instructions.
SPSS Output for Chi Square Test for Homogeneity

10. How to Interpret SPSS Output of Chi-Square Test for Homogeneity
SPSS will generate output, including the Crosstabulation Table, Chi-Square Tests, Symmetric Measures and bar plot.
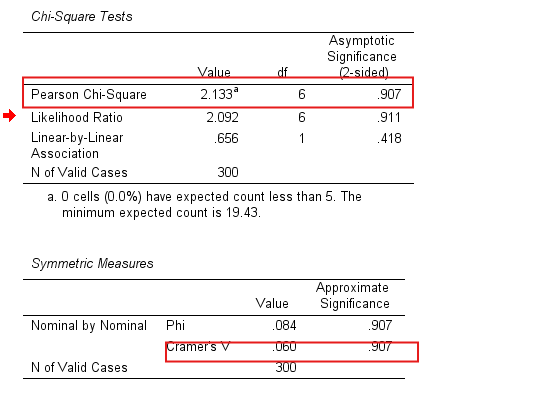
- Chi-Squared Test Table: This table provides the Chi-Square statistic, degrees of freedom (df), and the p-value. If the p-value is less than the chosen significance level (commonly 0.05).
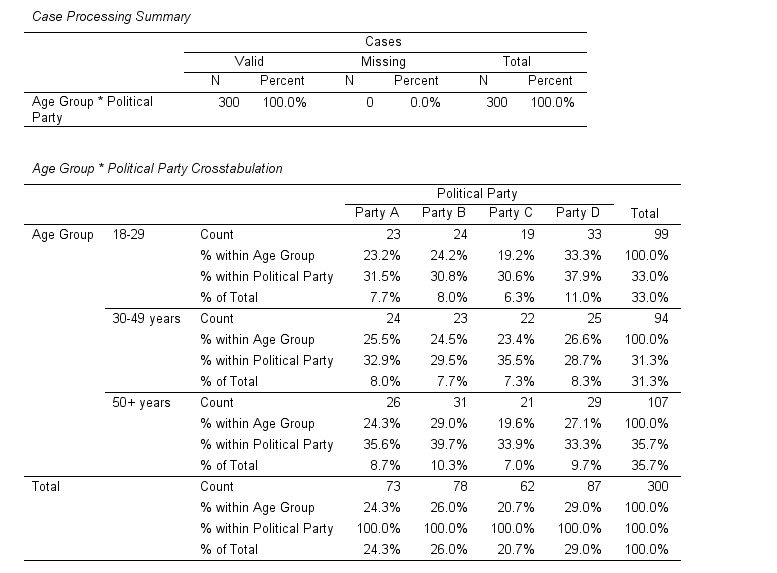
- Crosstabulation Table: This table presents the observed and expected frequencies for each category combination of the two variables. You can also examine row and column percentages to understand the distribution of responses within each category.
- Effect Size Table (Symmetric Measures): Phi and Cramér’s V values measure the strength of the association between the two categorical variables. Values range from 0 (no association) to 1 (perfect association).
- Bar Plot: The bar plot visually compares the distribution of responses for each category of the variables.
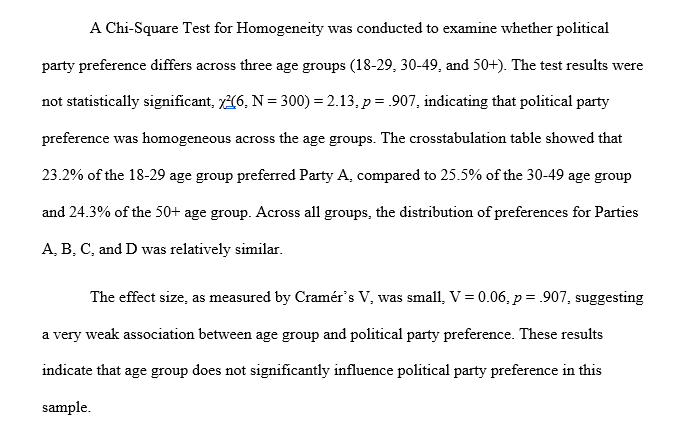
11. How to Report Results of Chi-Square Test for Homogeneity in APA
Reporting the results of chi square test for Homogeneity in APA (American Psychological Association) format requires a structured presentation. Here’s a step-by-step guide in list format:
- Introduction: Briefly describe the purpose of the analysis and the theoretical background.
- Method: Detail the data collection process, variables used, and the model specified.
- Results: Present the parameter estimates with their standard errors, and significance levels.
- Figures and Tables: Include relevant plots and tables, ensuring they are properly labeled and referenced.
- Discussion: Interpret the results, highlighting the significance of the findings and their implications.
- Conclusion: Summarise the main points and suggest potential areas for further research.
Get Support For Your SPSS Data Analysis
Embark on a seamless research journey with SPSSAnalysis.com, where our dedicated team provides expert data analysis assistance for students, academicians, and individuals. We ensure your research is elevated with precision. Explore our pages;
- Biostatistical Modeling Expert
- Statistical Methods for Clinical Studies
- Epidemiological Data Analysis
- Biostatistical Support for Researchers
- Clinical Research Data Analysis
- Medical Data Analysis Expert
- Biostatistics Consulting
- Healthcare Data Statistics Consultant
- SPSS Help by Subjects Area: Psychology, Sociology, Nursing, Education, Medical, Healthcare, Epidemiology, Marketing
Connect with us at SPSSAnalysis.com to empower your research endeavors and achieve impactful data analysis results. Get a FREE Quote Today!