Cross Tabulation in SPSS
Discover the Cross Tabulation in SPSS! Learn how to perform, understand SPSS output, and report results in APA style. Check out this simple, easy-to-follow guide below for a quick read!
Struggling with the Contingency table in SPSS? We’re here to help. We offer comprehensive assistance to students, covering assignments, dissertations, research, and more. Request Quote Now!

1. Introduction
Cross tabulation, often referred to as a contingency table, is a statistical tool used to summarise the relationship between two or more categorical variables. It helps researchers and data analysts visualise how variables interact with one another. By organising data into a matrix format, cross tabulation allows for easy comparison of category frequencies. This method is highly effective in identifying patterns, relationships, and associations between variables, making it widely used in fields like social sciences, healthcare, and marketing.
Several key terms relate to the Crosstabs:
- Cross Tabulation: A method of summarising categorical data by displaying the frequency distribution of the variables in a matrix format.
- Contingency Table: A table used in the Chi-Square test that shows the observed frequency counts for each combination of the variables.
- Effect Sizes for Chi-Square: Effect size measures include Phi (φ), Cramér’s V, Gamma, Somers’d, and Kendall’s tau-b. These effect sizes help quantify the strength of the association.
In SPSS, cross tabulation is straightforward and efficient to use. With a few steps, you can create a contingency table that displays the observed counts for each combination of variable categories. This helps you not only to describe data but also to conduct further statistical tests, such as Chi-Square or Fisher’s Exact Test, for testing the significance of the relationships between variables.
2. What is cross-tabulation in Statistics?
Cross tabulation is a method of examining the relationship between two or more categorical variables by organising the data into rows and columns. Each cell in the resulting table shows the frequency count or proportion of cases for a specific combination of variable categories. Cross tabulation provides an easy-to-read summary that allows you to analyse how often certain combinations occur.
For example, a business might want to explore the relationship between customer age group and product preference. The cross-tabulated data would display how many customers from each age group prefer a certain product. By breaking the data into a grid format, you can quickly identify trends and associations that may not be obvious from raw data alone.
3. What is the Contingency Table used for?
A contingency table, the output of cross-tabulation, serves multiple purposes in data analysis. Firstly, it helps in summarising the distribution of data across categories, showing how different groups are represented. Secondly, contingency tables are useful for identifying relationships and associations between two or more categorical variables. For example, you can use them to see whether gender affects purchasing preferences or how different educational backgrounds impact voting patterns.
Additionally, contingency tables are the foundation for conducting statistical tests. Researchers often use them to perform Chi-Square Tests for Independence or Homogeneity, as well as Fisher’s Exact Test, to assess whether there is a significant relationship between the variables. By examining the observed and expected frequencies in the table, these tests provide deeper insights into the data.
4. Explain Differences among Chi-Square Tests of Independence, Goodness Fit, Association, Homogeneity and Fisher’s Exact
- Chi-Square Test for Association: Determines if two categorical variables are associated or independent by comparing observed and expected frequencies in a contingency table.
- Chi-Square Test of Independence: Similar to the test for association, it assesses whether two variables are independent. The key difference lies in the context of the research question, with independence tests often focusing on whether the distribution of one variable is unaffected by the other.
- Chi-Square Goodness-of-Fit Test: Compares observed frequencies of a single categorical variable to a theoretically expected distribution. Researchers use it to determine if a sample fits a specific distribution.
- Chi-Square Test of Homogeneity: Tests whether two or more groups are homogeneous in terms of the distribution of a categorical variable. This test is used to compare the proportions across different populations.
- Fisher’s Exact Test: Fisher’s Exact Test is an alternative to the Chi-Squared test for 2×2 contingency tables, especially when sample sizes are small or when expected frequencies are less than 5. Unlike the Chi-Squared test, Fisher’s Exact Test provides an exact p-value, making it more accurate when dealing with small or sparse data. It is particularly useful when the assumptions of the Chi-Squared test are not met.
5. An Example of the Cross-Tabulation
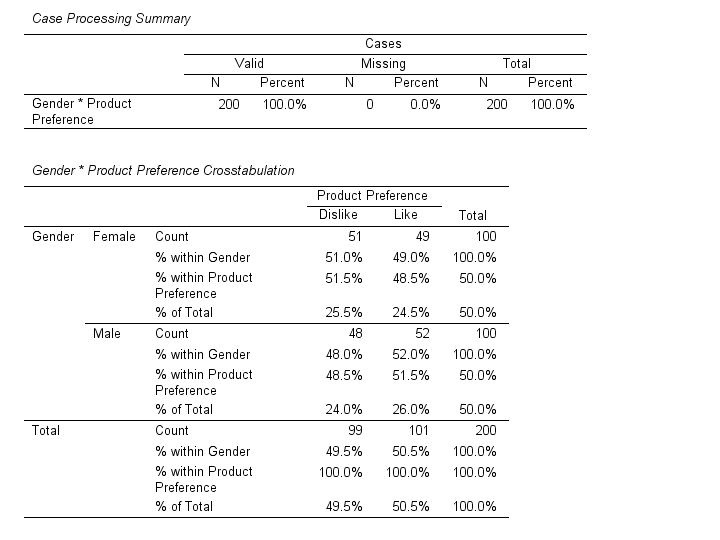
Consider a study investigating the relationship between gender and preference for a new product. The two categorical variables are gender (male and female) and product preference (like and dislike). The researcher collects data from a survey of 200 respondents, cross-tabulating the responses to create a contingency table.
Using the Chi-Square Test for Association, the researcher compares the observed frequencies of responses with the expected frequencies (assuming no association). If the Chi-Squared test statistic exceeds the critical value from the Chi-Squared distribution table, the researcher concludes that gender is significantly associated with product preference.


Step by Step: Contingency Table in SPSS Statistics
Let’s embark on a step-by-step guide on doing the Cross Tabulation using SPSS
- STEP: Load Data into SPSS
Commence by launching SPSS and loading your dataset, which should encompass the variables of interest – a categorical independent variable. If your data is not already in SPSS format, you can import it by navigating to File > Open > Data and selecting your data file.
- STEP: Access the Analyze Menu
In the top menu, click on Analyse > Descriptive Statistics > Crosstabs.
- STEP: Specify Variables
- Assign one variable to the row and the other to the column in the crosstabs dialogue box.
- Check Expected Counts: Enable the expected counts to compare observed and expected values.
- STEP: Generate SPSS Output
- Click ‘OK’ after selecting your variables and method. SPSS will run the analysis and generate output tables and survival curves.
Note: Conducting the crosstans in SPSS provides a robust foundation for understanding the key features of your data. Always ensure that you consult the documentation corresponding to your SPSS version, as steps might slightly differ based on the software version in use. This guide is tailored for SPSS version 25, and for any variations, it’s recommended to refer to the software’s documentation for accurate and updated instructions.
SPSS Output for Cross Tabulation
7. How to Interpret SPSS Output of Cross Tabulation
SPSS will generate output, including the Crosstabulation Table, Chi-Square Tests, Symmetric Measures and bar plot.
- Chi-Squared Test Table: This table provides the Chi-Square statistic, degrees of freedom (df), and the p-value. If the p-value is less than the chosen significance level (commonly 0.05).
- Crosstabulation Table: This table presents the observed and expected frequencies for each category combination of the two variables. You can also examine row and column percentages to understand the distribution of responses within each category.
- Effect Size Table (Symmetric Measures): Phi and Cramér’s V values measure the strength of the association between the two categorical variables. Values range from 0 (no association) to 1 (perfect association).
- Bar Plot: The bar plot visually compares the distribution of responses for each category of the variables.
8. How to Report Results of Chi-Square Test and Cross Tabulation in APA
Reporting the results of Chi Square test and Crosstabs in APA (American Psychological Association) format requires a structured presentation. Here’s a step-by-step guide in list format:
- Introduction: Briefly describe the purpose of the analysis and the theoretical background.
- Method: Detail the data collection process, variables used, and the model specified.
- Results: Present the parameter estimates with their standard errors, and significance levels.
- Figures and Tables: Include relevant plots and tables, ensuring they are properly labeled and referenced.
- Discussion: Interpret the results, highlighting the significance of the findings and their implications.
- Conclusion: Summarise the main points and suggest potential areas for further research.

Get Support For Your SPSS Data Analysis
Embark on a seamless research journey with SPSSAnalysis.com, where our dedicated team provides expert data analysis assistance for students, academicians, and individuals. We ensure your research is elevated with precision. Explore our pages;
- Biostatistical Modeling Expert
- Statistical Methods for Clinical Studies
- Epidemiological Data Analysis
- Biostatistical Support for Researchers
- Clinical Research Data Analysis
- Medical Data Analysis Expert
- Biostatistics Consulting
- Healthcare Data Statistics Consultant
- SPSS Help by Subjects Area: Psychology, Sociology, Nursing, Education, Medical, Healthcare, Epidemiology, Marketing
Connect with us at SPSSAnalysis.com to empower your research endeavors and achieve impactful data analysis results. Get a FREE Quote Today!