Wald Wolfowitz Run Test in SPSS
Discover the Wald Wolfowitz Run Test in SPSS! Learn how to perform, understand SPSS output, and report results in APA style. Check out this simple, easy-to-follow guide below for a quick read!
Struggling with the Wald Wolfowitz Run Test in SPSS? We’re here to help. We offer comprehensive assistance to students, covering assignments, dissertations, research, and more. Request Quote Now!

1. Introduction
Understanding statistical tests can significantly enhance your data analysis capabilities, especially when it comes to validating hypotheses and ensuring data reliability. One such important statistical test is the Wald-Wolfowitz Runs Test. This non-parametric test is crucial for evaluating the randomness of a sequence of observations, making it a valuable tool for researchers and analysts across various fields. In this blog post, we will delve deep into the Wald-Wolfowitz Runs Test, focusing on its application within SPSS, a widely used statistical software.
In the following sections, we will explore the fundamentals of the Wald-Wolfowitz Runs Test, its uses, and how it differs from other statistical tests like the Mann-Whitney U test. Additionally, we will guide you through the assumptions, hypotheses, and practical examples, culminating in a step-by-step tutorial on performing the test in SPSS. By the end of this post, you will have a comprehensive understanding of the Wald-Wolfowitz Runs Test and how to effectively interpret and report its results.
2. Wald-Wolfowitz Runs Test in Statistics
The Wald-Wolfowitz Runs Test is a non-parametric statistical test used to determine the randomness of a sequence of two types of elements. Developed by Abraham Wald and Jacob Wolfowitz, this test is particularly useful for binary data sequences, helping analysts to assess whether the order of elements in a sequence is random. Unlike parametric tests, the Wald-Wolfowitz Runs Test does not assume a specific distribution for the data, making it versatile and widely applicable.
Firstly, the test identifies runs within the sequence, where a run is defined as a series of consecutive identical elements. Secondly, it calculates the number of such runs and compares this to the expected number of runs under the null hypothesis of randomness. If the observed number of runs significantly deviates from the expected number, it suggests that the sequence may not be random, thus providing valuable insights into the data structure.
3. What is the Wald-Wolfowitz Runs Test used for?
Primarily, the Wald-Wolfowitz Runs Test assesses the randomness of a sequence, which is essential in various fields such as quality control, finance, and biological research. For instance, in quality control, this test can evaluate whether defects in a manufacturing process occur randomly or follow a specific pattern. In finance, analysts can use it to determine if stock price movements are random or exhibit trends that can inform investment strategies.
Moreover, the test is invaluable in biological and medical research. Researchers might use the Wald-Wolfowitz Runs Test to analyse the distribution of genetic markers or the occurrence of specific events in a clinical trial. By determining the randomness of such sequences, researchers can draw more accurate conclusions and avoid potential biases that could affect the validity of their studies.
4. Mann-Whitney U test and Wald-Wolfowitz Runs test
Firstly, the Mann-Whitney U test and the Wald-Wolfowitz Runs Test serve different purposes in statistical analysis. The Mann-Whitney U test, also known as the Wilcoxon rank-sum test, compares the central tendencies of two independent samples to determine if they come from the same distribution. It ranks all observations from both samples and evaluates the sum of ranks to ascertain differences between the groups.
In contrast, the Wald-Wolfowitz Runs Test focuses on the sequence and order of observations rather than their ranks or values. This test evaluates the randomness of a sequence by counting the number of runs, providing insights into the underlying pattern of the data. While the Mann-Whitney U test is useful for comparing distributions, the Wald-Wolfowitz Runs Test is ideal for assessing randomness and detecting non-random patterns in data sequences
5. What Are Other Nonparametric Tests?
- Mann-Whitney U Test: Compares differences between two independent groups when the data are not normally distributed.
- Kruskal-Wallis Test: Extends the Mann-Whitney U Test to more than two groups, assessing rank differences—nonparametric alternative to One-Way ANOVA Test.
- Wilcoxon Signed-Rank Test: Compares two related samples or repeated measurements on a single sample to assess differences in their ranks.
- McNemar Test: Used for paired nominal data to determine changes in proportions.
- Friedman Test: Nonparametric alternative to repeated measures ANOVA, comparing ranks across multiple related groups.
- Sign Test: Evaluates the median of a single sample or compares medians of two related samples.
- Cochran’s Q Test: Extension of the McNemar test for more than two related groups.
- Kendall’s W: Assesses the agreement between raters.
- Binomial Test: Tests the observed proportion against a theoretical proportion.
- Jonckheere-Terpstra Test: Tests for ordered differences among groups.
- Marginal Homogeneity Test: Assesses changes in proportions in paired categorical data.
- Median Test: Compares the medians of two or more groups.
6. The Assumptions of the Wald-Wolfowitz Runs Test
When using the Wald-Wolfowitz Runs Test, it’s essential to ensure that certain assumptions are met to guarantee valid results. These assumptions include:
- The observations should be independent of each other.
- The test requires two distinct categories or groups.
- The data should consist of a sequence of binary outcomes.
- The sample size should be large enough to approximate the distribution of the number of runs to a normal distribution.
- The observations should be in a meaningful order as the test evaluates the sequence.
7. What is the Hypothesis of the Wald-Wolfowitz Runs Test?
The Wald-Wolfowitz Runs Test evaluates the following hypotheses:
– Null Hypothesis (H0): The sequence of observations is random, indicating that the observed number of runs aligns with what would be expected under randomness. This means there is no significant pattern or clustering in the data sequence, and the two samples come from the same distribution.
– Alternative Hypothesis (H1): The sequence of observations is not random, suggesting that the observed number of runs significantly deviates from the expected number. This implies that there is a pattern or clustering in the data sequence, and the two samples come from different distributions.
These hypotheses form the foundation of the test, guiding the analysis to determine if the sequence exhibits non-random patterns or if the two samples are from different distributions.
8. An Example of the Wald-Wolfowitz Runs Test
Consider a scenario where a researcher wants to compare the distribution of two groups: Group A and Group B. Group A represents the control group, while Group B represents the experimental group. Each group consists of 30 observations.
The researcher combines and sorts the data to perform the Wald-Wolfowitz Runs Test. The goal is to determine if the two groups come from the same distribution or if there is a significant difference between them.

Step by Step: Running the Wald-Wolfowitz Runs Test in SPSS Statistics
Performing the Wald-Wolfowitz Runs Test in SPSS involves several steps to ensure accurate analysis. Follow these steps to execute the test:
- Input Data: Enter your data into SPSS, ensuring that each observation is correctly recorded in a single column. Label the groups clearly as ‘A’ for the control group and ‘B’ for the experimental group.
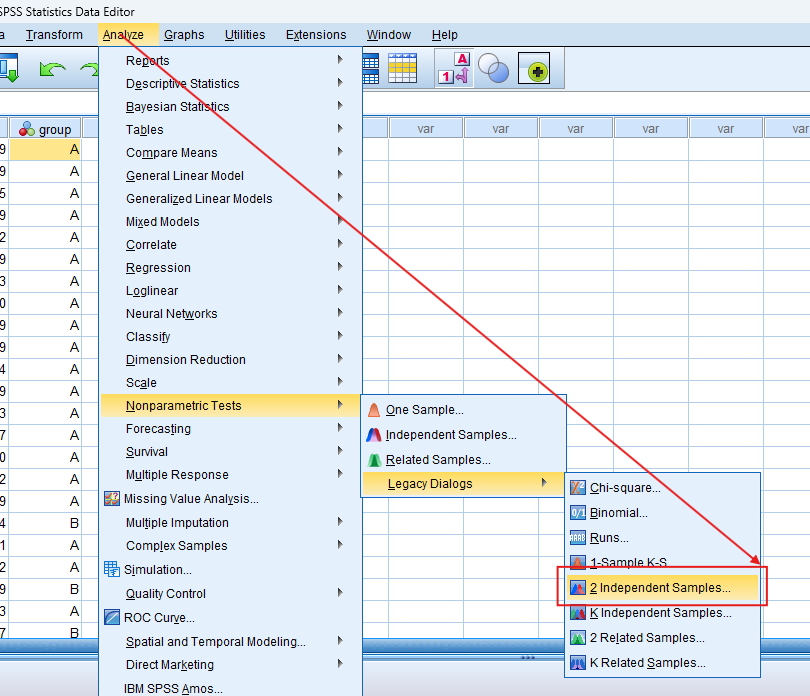
- Accessing the Test: Navigate to the ‘Analyze’ menu. Select ‘Nonparametric Tests’, then choose ‘Legacy Dialogs’, and finally select ‘2 Independent Samples’.
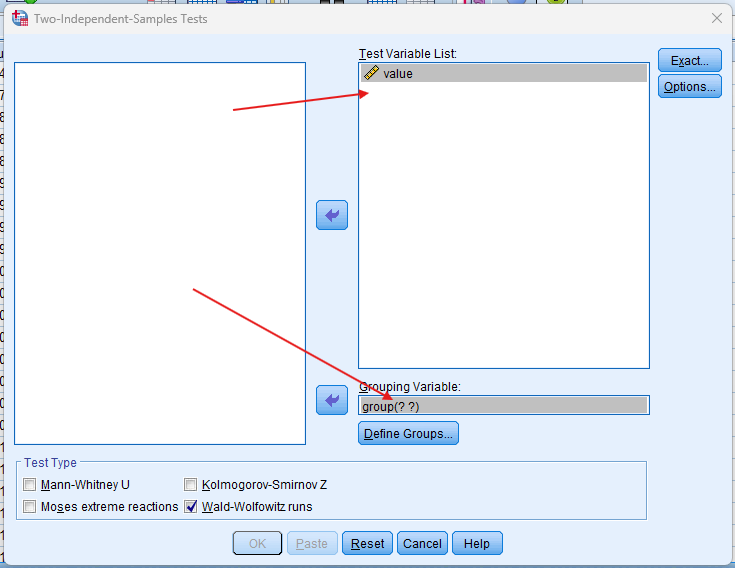
- Setting Variables: In the ‘Two-Independent-Samples Tests’ dialog box, set your test variable to the combined data values and the grouping variable to the group labels (A and B). Choose ‘Wald-Wolfowitz’ as the test type.
- Running the Test: Click ‘OK’ to run the test. SPSS will generate the necessary output, including the observed number of runs, expected runs, and the Z-value for the test statistic.
Note: Conducting the Wald-Wolfowitz Runs Test in SPSS provides a robust foundation for understanding the key features of your data. Always ensure that you consult the documentation corresponding to your SPSS version, as steps might slightly differ based on the software version in use. This guide is tailored for SPSS version 25, and for any variations, it’s recommended to refer to the software’s documentation for accurate and updated instructions.
10. SPSS Output for Wald Wolfowitz Run Test

11. How to Interpret SPSS Output of Wald-Wolfowitz Runs Test
Interpreting the SPSS output for the Wald-Wolfowitz Runs Test involves understanding the key elements presented in the output tables. Follow these steps to make sense of the results:
- Number of Runs: Locate the table showing the number of runs observed in the dataset. This indicates how many sequences of consecutive identical elements were found.
- Z-value and P-value: Examine the Z-value and the associated p-value. The Z-value represents the standardised test statistic, while the p-value indicates the probability of observing such a result under the null hypothesis.
- Decision Rule: If the p-value is below your chosen significance level (typically 0.05), reject the null hypothesis, concluding that the sequences for the two groups are not random and come from different distributions. Conversely, a p-value above the significance level suggests no significant difference between the distributions.
By following these steps, you can accurately interpret the SPSS output for the Wald-Wolfowitz Runs Test, allowing you to determine whether your data sequence is random or if there is a significant difference between the two groups.
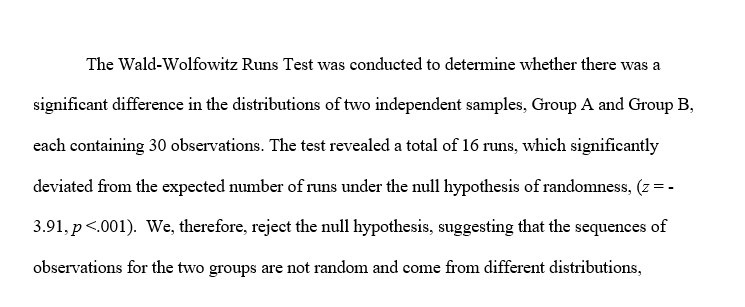
12. How to Report Results of the Wald-Wolfowitz Runs Test in APA
Reporting the results of the Wald-Wolfowitz Runs Test in APA (American Psychological Association) format requires a structured presentation. Here’s a step-by-step guide in list format:
- Introduction: Begin by describing the purpose of the analysis. Briefly describe the repeated measures data and context.
- Method: Detail the data collection process and the variables involved.
- Results: Present the key statistics from the SPSS output. Include the Z score, degrees of freedom, and p-value.
- Discussion: Interpret the results, highlighting the significance of the findings. Explain what the lack of a significant difference means in the context of the research question.
- Conclusion: Summarise the main points of the analysis. Explain the implications of your findings within the context of your study.
Get Help For Your SPSS Analysis
Embark on a seamless research journey with SPSSAnalysis.com, where our dedicated team provides expert data analysis assistance for students, academicians, and individuals. We ensure your research is elevated with precision. Explore our pages;
- SPSS Help by Subjects Area: Psychology, Sociology, Nursing, Education, Medical, Healthcare, Epidemiology, Marketing
- Dissertation Methodology Help
- Dissertation Data Analysis Help
- Dissertation Results Help
- Pay Someone to Do My Data Analysis
- Hire a Statistician for Dissertation
- Statistics Help for DNP Dissertation
- Pay Someone to Do My Dissertation Statistics
Connect with us at SPSSAnalysis.com to empower your research endeavors and achieve impactful data analysis results. Get a FREE Quote Today!