Kendall's W Test in SPSS
Discover the Kendall’s W Test in SPSS! Learn how to perform, understand SPSS output, and report results in APA style. Check out this simple, easy-to-follow guide below for a quick read!
Struggling with Kendall’s W Test in SPSS? We’re here to help. We offer comprehensive assistance to students, covering assignments, dissertations, research, and more. Request Quote Now!
1. Introduction
Understanding how to measure agreement among raters is crucial in various fields, including psychology, education, and market research. Kendall’s W Test, also known as Kendall’s Coefficient of Concordance, serves as a nonparametric statistical method to assess this agreement. When researchers need to evaluate the consistency among multiple raters or judges, Kendall’s W Test offers a robust solution. This test becomes particularly useful when the data are ordinal and do not meet the assumptions required for parametric tests.
In this blog post, we will explore Kendall’s W Test within the context of SPSS, a powerful statistical software widely used for data analysis. By the end of this article, you will understand how to perform Kendall’s W Test in SPSS, interpret the results, and report them accurately. This guide aims to provide comprehensive insights into the test, ensuring you can apply it effectively in your research and analysis projects.
2. Kendall’s W Test in Statistics
Kendall’s W Test is a nonparametric statistical method used to measure the degree of agreement among raters. Unlike other correlation coefficients, Kendall’s W specifically assesses how consistently multiple raters rank a set of items. The test calculates a coefficient, W, which ranges from 0 (no agreement) to 1 (complete agreement). This coefficient indicates the strength of the concordance among the raters.
Firstly, Kendall’s W Test ranks the data for each rater and then evaluates the extent of agreement across these ranks. Secondly, it sums the ranks for each item and uses these sums to compute the W statistic. This approach makes Kendall’s W Test particularly suitable for ordinal data, where traditional parametric methods may not be applicable. As a result, researchers can rely on Kendall’s W to assess inter-rater reliability effectively.
Kendall’s Concordance Coefficient W
Kendall’s Concordance Coefficient W quantifies the level of agreement among multiple raters. This coefficient ranges from 0 to 1, where 0 indicates no agreement and 1 signifies perfect agreement. The calculation of W involves ranking the data for each rater and then assessing the variability of these ranks across raters. Lower variability suggests higher agreement, leading to a higher W value.
To compute W, the test sums the ranks for each item across all raters and evaluates these sums to determine the concordance. A high W value indicates that the raters have ranked the items similarly, reflecting strong agreement. Conversely, a low W value suggests discrepancies in the rankings, indicating weak agreement among the raters. By using Kendall’s W, researchers can objectively measure the reliability of subjective evaluations.
3. What is Kendall’s W Test used for?
Researchers use Kendall’s W Test to assess the consistency of rankings among multiple raters. This test proves essential in situations where subjective judgment plays a significant role, such as in educational assessments, psychological evaluations, and market research. For instance, when evaluating the performance of students or employees, multiple raters might rank their performance. Kendall’s W Test helps determine the degree of agreement among these raters, ensuring the reliability of the evaluations.
Moreover, Kendall’s W Test is valuable in situations where other measures of agreement, such as Cohen’s Kappa, are not suitable. Unlike Cohen’s Kappa, which is designed for nominal data, Kendall’s W handles ordinal data effectively. This flexibility makes Kendall’s W Test a preferred choice for researchers dealing with ranked data, providing robust insights into the level of concordance among raters.
4. When to use: Friedman Test, Cochran’s Q Test, Kendall’s W
- Friedman Test: Use the Friedman Test when you have repeated measures data involving more than two related groups. This test evaluates differences in treatments across multiple test attempts, making it ideal for situations where the same subjects are measured under different conditions or treatments. For example, a researcher might use the Friedman Test to compare the effectiveness of three different diets on weight loss among the same group of participants.
- Cochran’s Q Test: Apply Cochran’s Q Test when dealing with dichotomous (binary) data collected from the same subjects under different conditions. This test extends McNemar’s Test to more than two related groups. It is particularly useful for testing whether the proportions of a binary outcome differ across multiple related groups. For instance, a medical researcher might use Cochran’s Q Test to determine if the response rates to a treatment differ across three different time points in the same group of patients.
- Kendall’s W: Kendall’s W, or Kendall’s Coefficient of Concordance, measures the agreement among raters or the consistency of rankings assigned by multiple judges. Use Kendall’s W when you want to assess the degree of association between rankings of different judges or measurements. This test is beneficial in scenarios where you need to determine the consistency of subjective ratings. For example, Kendall’s W can help evaluate the agreement among judges in a talent competition or the consistency of ratings assigned to research papers by different reviewers.
Each of these tests serves a unique purpose in statistical analysis. The Friedman Test is ideal for comparing related groups with ordinal or continuous data, Cochran’s Q Test is perfect for binary outcomes in related samples, and Kendall’s W assesses agreement among multiple raters. Understanding when to use each test ensures accurate and meaningful analysis of your data.
5. What Are Other Nonparametric Tests?
- Mann-Whitney U Test: Compares differences between two independent groups when the data are not normally distributed.
- Kruskal-Wallis Test: Extends the Mann-Whitney U Test to more than two groups, assessing rank differences—nonparametric alternative to One-Way ANOVA Test.
- Wilcoxon Signed-Rank Test: Compares two related samples or repeated measurements on a single sample to assess differences in their ranks.
- McNemar Test: Used for paired nominal data to determine changes in proportions.
- Friedman Test: Nonparametric alternative to repeated measures ANOVA, comparing ranks across multiple related groups.
- Sign Test: Evaluates the median of a single sample or compares medians of two related samples.
- Cochran’s Q Test: Extension of the McNemar test for more than two related groups.
- Binomial Test: Tests the observed proportion against a theoretical proportion.
- Jonckheere-Terpstra Test: Tests for ordered differences among groups.
- Wald-Wolfowitz Runs Test: Evaluates the randomness of a sequence.
- Marginal Homogeneity Test: Assesses changes in proportions in paired categorical data.
- Median Test: Compares the medians of two or more groups.
6. The Assumptions of the Kendall’s W
- Ordinal Data: The data must be ordinal, meaning the items are ranked in a meaningful order.
- Multiple Raters: There must be multiple raters evaluating the same set of items.
- Independent Rankings: The rankings provided by each rater should be independent of one another.
- Complete Rankings: Each rater should rank all items without ties.
7. The Hypothesis of the Kendall’s W
Kendall’s W Test operates under two hypotheses.
- The null hypothesis (H0): there is no agreement among the raters.
- The alternative hypothesis (H1): there is a significant agreement among the raters.
H0 is implying that the observed rankings are due to chance. In this context, W would be close to 0, indicating a lack of concordance. Rejecting the null hypothesis suggests that the rankings are not random and that there is a significant level of agreement among the raters. Secondly, If the W value is significantly greater than 0, it indicates that the raters have ranked the items consistently. This finding supports the presence of concordance among the raters, reflecting a reliable evaluation process. Researchers aim to determine whether to reject the null hypothesis based on the calculated W value and its associated significance level.
8. An Example of the Kendall’s W in SPSS
Consider a study where five judges rank ten paintings in a competition. To perform Kendall’s W Test in SPSS, input the rankings provided by each judge for all paintings. The data should be structured so that each row represents a painting and each column represents a judge’s rankings. Select the Kendall’s W Test from the nonparametric tests menu and run the analysis.
The SPSS output will include the W statistic and a significance level (p-value). If the p-value is less than 0.05, you reject the null hypothesis, indicating significant agreement among the judges. This result suggests that the judges consistently ranked the paintings similarly, providing reliable assessments. Such a finding would reinforce the credibility of the competition’s evaluation process.
Step by Step: Running the Kendall’s W in SPSS Statistics
Let’s embark on a step-by-step guide on performing Kendall’s W using SPSS
- Input Data: Enter your repeated measures data into separate columns in SPSS.
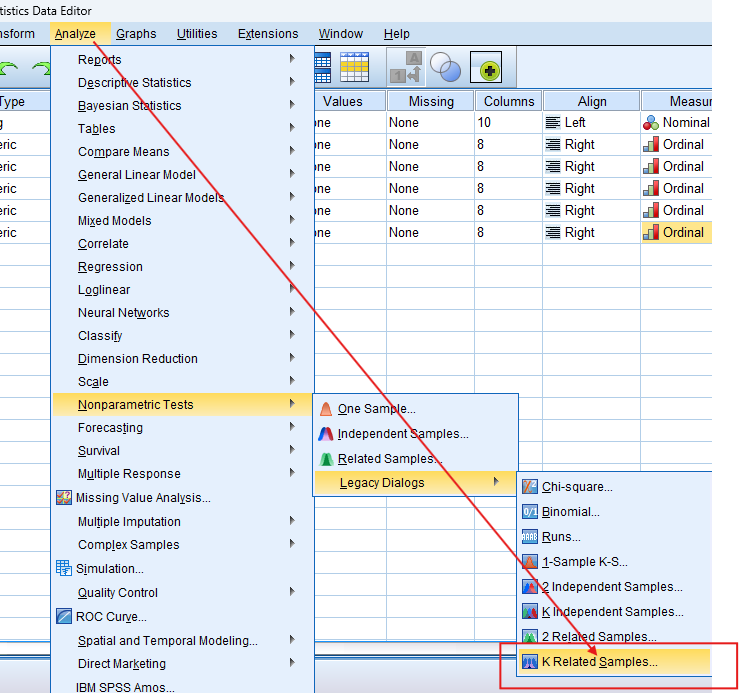
- Select Test: Navigate to `Analyze` > `Nonparametric Tests` > `K Related Samples`.
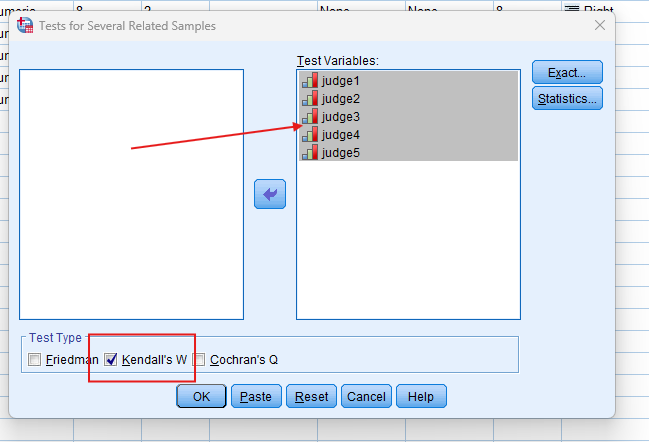
- Choose Variables: Select the variables representing your repeated measures.
- Run Test: Click `OK` to run the test.
- Review Output: SPSS will generate output tables with the test statistics and significance levels.
Note: Conducting Kendall’s W in SPSS provides a robust foundation for understanding the key features of your data. Always ensure that you consult the documentation corresponding to your SPSS version, as steps might slightly differ based on the software version in use. This guide is tailored for SPSS version 25, and for any variations, it’s recommended to refer to the software’s documentation for accurate and updated instructions.
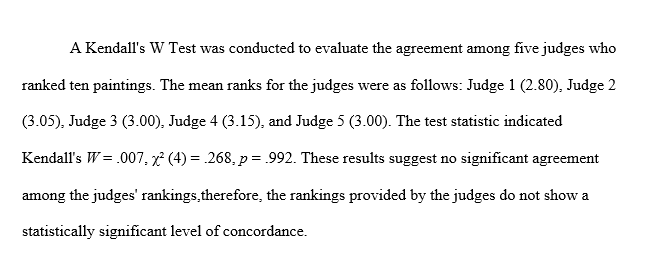
10. SPSS Output for Kendall's W Test
11. How to Interpret SPSS Output of Kendall’s W Test
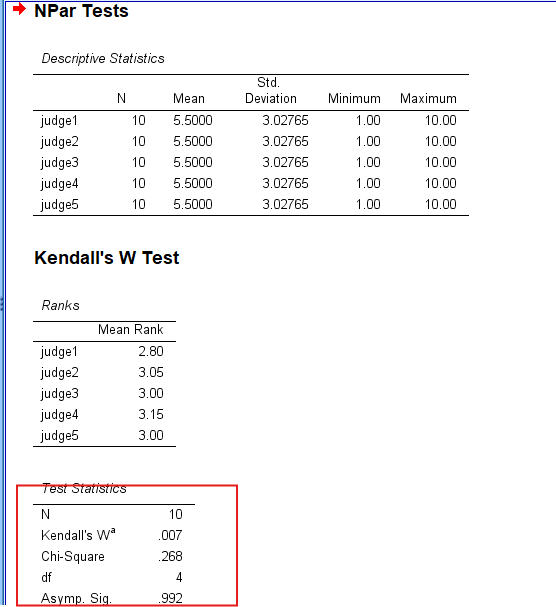
Upon running Kendall’s W Test in SPSS, you will receive output tables displaying key statistics. The `Test Statistics` table includes the Chi-square value, degrees of freedom, and the asymptotic significance (p-value). A p-value less than 0.05 typically indicates a significant difference across the related groups.
Additionally, the `Descriptive Statistics` table provides mean ranks for each group, helping identify which groups differ from the others. Interpreting these tables helps determine the direction and significance of the observed differences, guiding researchers in drawing meaningful conclusions from their data.
12. How to Report Results of Kendall’s W Test in APA
Reporting the results of Kendall’s W Test in APA (American Psychological Association) format requires a structured presentation. Here’s a step-by-step guide in list format:
- Introduction: Begin by describing the purpose of the analysis. Briefly describe the repeated measures data and context.
- Method: Detail the data collection process and the variables involved. Specify that the test ranks all values from both groups combined, then calculates the sum of the ranks for each group to determine the Chi-square statistic.
- Results: Present the key statistics from the SPSS output. Include the Chi-square value, the W value degrees of freedom, and p-value.
- Discussion: Interpret the results, highlighting the significance of the findings. Explain what the lack of a significant difference means in the context of the research question.
- Conclusion: Summarise the main points of the analysis. Explain the implications of your findings within the context of your study.
Get Help For Your SPSS Analysis
Embark on a seamless research journey with SPSSAnalysis.com, where our dedicated team provides expert data analysis assistance for students, academicians, and individuals. We ensure your research is elevated with precision. Explore our pages;
- SPSS Help by Subjects Area: Psychology, Sociology, Nursing, Education, Medical, Healthcare, Epidemiology, Marketing
- Dissertation Methodology Help
- Dissertation Data Analysis Help
- Dissertation Results Help
- Pay Someone to Do My Data Analysis
- Hire a Statistician for Dissertation
- Statistics Help for DNP Dissertation
- Pay Someone to Do My Dissertation Statistics
Connect with us at SPSSAnalysis.com to empower your research endeavors and achieve impactful data analysis results. Get a FREE Quote Today!