Cochran's Q Test in SPSS
Discover Cochran’s Q Test in SPSS! Learn how to perform, understand SPSS output, and report results in APA style. Check out this simple, easy-to-follow guide below for a quick read!
Struggling with Cochran’s Q Test in SPSS? We’re here to help. We offer comprehensive assistance to students, covering assignments, dissertations, research, and more. Request Quote Now!
1. Introduction
Understanding statistical tests can greatly enhance the accuracy and reliability of your research findings. Among the many statistical tests available, Cochran’s Q Test stands out as a crucial tool for analysing dichotomous data in a repeated measures design. This blog post delves into the intricacies of Cochran’s Q Test, particularly focusing on its application within the SPSS software. By the end of this guide, you will be well-versed in performing, interpreting, and reporting this test effectively.
In the world of data analysis, Cochran’s Q Test helps to determine if there are differences between three or more matched groups. Researchers across various fields, including psychology, medicine, and social sciences, frequently utilise this test. Whether you are a researcher or a novice, this blog post will provide you with the essential knowledge and step-by-step guidance needed to master Cochran’s Q Test in SPSS.
2. The Cochran’s Q Test in Statistics
Cochran’s Q Test, named after William G. Cochran, is a non-parametric statistical test. It evaluates whether there are differences in proportions between three or more related groups. This test is particularly useful when the data consists of binary responses, such as ‘yes’ or ‘no’ answers. By analysing these responses, researchers can identify significant variations across multiple conditions or time points.
Unlike other statistical tests that assume normal distribution, Cochran’s Q Test makes no such assumptions. This quality makes it robust and versatile for analysing dichotomous data. Furthermore, it builds on the foundation laid by the McNemar’s Test, extending its application to multiple groups rather than just two.
3. What is the Cochran’s Q Test used for?
Cochran’s Q Test is primarily used in situations where researchers need to compare the proportions of binary outcomes across three or more related groups. For example, it is often employed in clinical trials to compare the efficacy of different treatments over time. In educational research, it may be used to assess the effectiveness of various teaching methods across multiple assessments.
This test is invaluable when you need to determine whether there are statistically significant differences in dichotomous outcomes under different conditions. By applying Cochran’s Q Test, researchers can draw meaningful conclusions about their data, paving the way for more informed decision-making and robust scientific findings.
4. Repeated Measure ANOVA, McNemar’s Test vs Cochran’s Q Test
They each serve unique purposes in statistical analysis. Repeated Measure is used to compare means across multiple conditions or time points within the same group. It assumes that the data follows a normal distribution and measures continuous variables, making it different from Cochran’s Q Test, which deals with binary data.
McNemar’s Test, on the other hand, is designed to compare proportions between two related groups. While Cochran’s Q Test extends this comparison to three or more groups, McNemar’s Test is limited to a binary comparison. Therefore, Cochran’s Q Test can be seen as an extension of McNemar’s Test for more complex experimental designs involving multiple conditions.
5. When to use: Friedman Test, Cochran’s Q Test, Kendall’s W
- Friedman Test: Use this Test when you have repeated measures data involving more than two related groups. This test evaluates differences in treatments across multiple test attempts, making it ideal for situations where the same subjects are measured under different conditions or treatments. For example, a researcher might use the Friedman Test to compare the effectiveness of three different diets on weight loss among the same group of participants.
- Cochran’s Q Test: Apply this rest when dealing with dichotomous (binary) data collected from the same subjects under different conditions. This test extends McNemar’s Test to more than two related groups. It is particularly useful for testing whether the proportions of a binary outcome differ across multiple related groups. For instance, a medical researcher might use Cochran’s Q Test to determine if the response rates to a treatment differ across three different time points in the same group of patients.
- Kendall’s W: Kendall’s W, or Kendall’s Coefficient of Concordance, measures the agreement among raters or the consistency of rankings assigned by multiple judges. Use Kendall’s W when you want to assess the degree of association between rankings of different judges or measurements. This test is beneficial in scenarios where you need to determine the consistency of subjective ratings. For example, Kendall’s W can help evaluate the agreement among judges in a talent competition or the consistency of ratings assigned to research papers by different reviewers.
6. What Are Other Nonparametric Tests?
- Mann-Whitney U Test: Compares differences between two independent groups when the data are not normally distributed.
- Kruskal-Wallis Test: Extends the Mann-Whitney U Test to more than two groups, assessing rank differences—nonparametric alternative to One-Way ANOVA Test.
- Wilcoxon Signed-Rank Test: Compares two related samples or repeated measurements on a single sample to assess differences in their ranks.
- McNemar Test: Used for paired nominal data to determine changes in proportions.
- Friedman Test: Nonparametric alternative to repeated measures ANOVA, comparing ranks across multiple related groups.
- Sign Test: Evaluates the median of a single sample or compares medians of two related samples.
- Kendall’s W: Assesses the agreement between raters.
- Binomial Test: Tests the observed proportion against a theoretical proportion.
- Jonckheere-Terpstra Test: Tests for ordered differences among groups.
- Wald-Wolfowitz Runs Test: Evaluates the randomness of a sequence.
- Marginal Homogeneity Test: Assesses changes in proportions in paired categorical data.
- Median Test: Compares the medians of two or more groups.
7. The Assumptions of the Cochran’s Q Test
- The data must be dichotomous, consisting of two possible outcomes (e.g., yes/no, success/failure).
- Each subject or case must be measured under three or more conditions.
- Samples are related, meaning the same subjects are tested across all conditions.
- The test does not require the assumption of normal distribution, making it suitable for non-parametric data.
- We assume that the observations are independent of each other within each condition.
8. The Hypothesis of the Cochran’s Q Test
The hypothesis of Cochran’s Q Test consists of the null hypothesis and the alternative hypothesis.
- Null hypothesis (H0): The proportions of successes are the same across all groups or conditions.
- Alternative hypothesis (H1): there is at least one group where the proportion of successes differs significantly from the others
In other words, there is no significant difference between the groups for null hypothesis. Any observed differences are likely due to random chance if the null hypothesis is true. Conversely, Rejecting the null hypothesis implies that the differences observed are statistically significant and not due to random variation. By testing these hypotheses, researchers can draw conclusions about the efficacy of different treatments or interventions.
9. An Example of the Cochran’s Q Test in SPSS
Consider a study evaluating the effectiveness of three different diets on weight loss. The researcher measures whether each participant has successfully lost weight after following each diet for a specified period. The data consists of binary responses (‘yes’ for weight loss, ‘no’ for no weight loss) for each participant across the three diets.
Using Cochran’s Q Test in SPSS, the researcher can determine if there are significant differences in the effectiveness of the diets. By inputting the data and running the test, SPSS will provide results that indicate whether any of the diets significantly outperform the others in terms of promoting weight loss.
Step by Step: Running Cochran’s Q Test in SPSS Statistics
Let’s embark on a step-by-step guide on performing the Cochran’s Q Test using SPSS
- Input Data: Enter your repeated measures data into separate columns in SPSS.
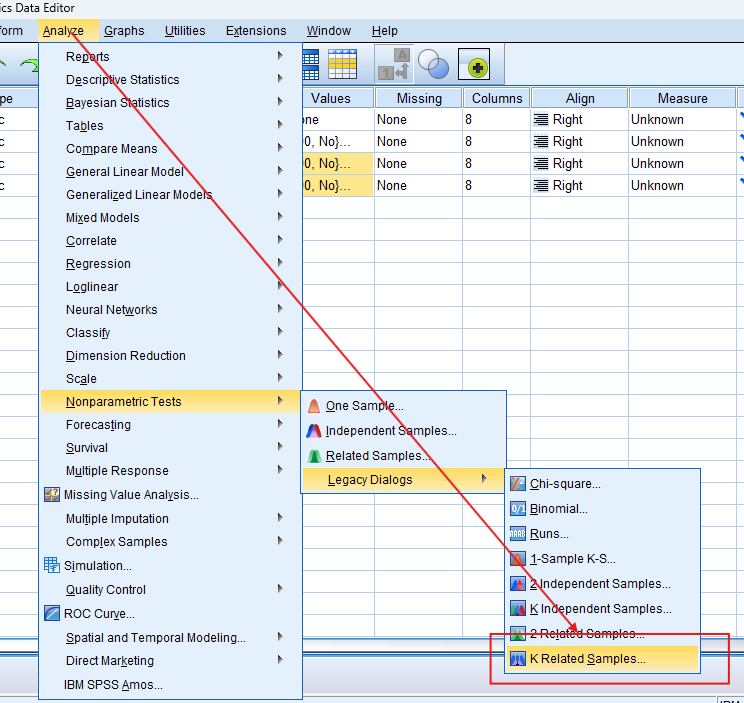
- Select Test: Navigate to `Analyze` > `Nonparametric Tests` > `K Related Samples`.
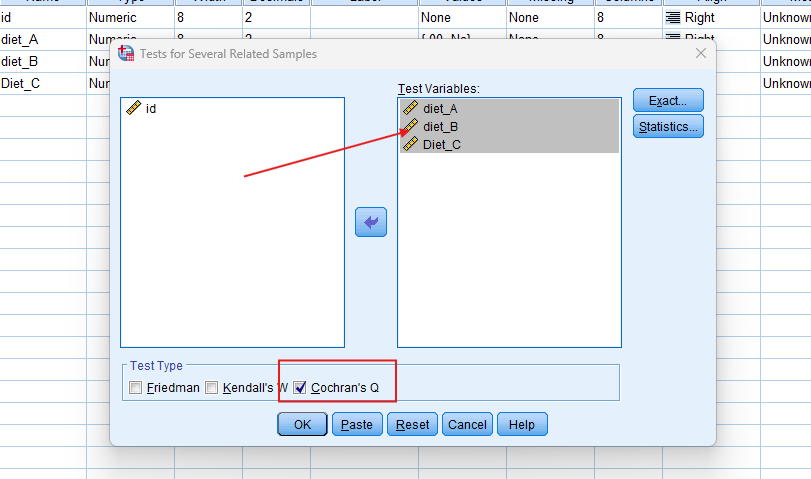
- Choose Variables: Select the variables representing your repeated measures.
- Run Test: Click `OK` to run the test.
- Review Output: SPSS will generate output tables with the test statistics and significance levels.
Note: Conducting Cochran’s Q Test in SPSS provides a robust foundation for understanding the key features of your data. Always ensure that you consult the documentation corresponding to your SPSS version, as steps might slightly differ based on the software version in use. This guide is tailored for SPSS version 25, and for any variations, it’s recommended to refer to the software’s documentation for accurate and updated instructions.
11. SPSS Output for Cochran's Q Test
12. How to Interpret SPSS Output of Cochran’s Q Test
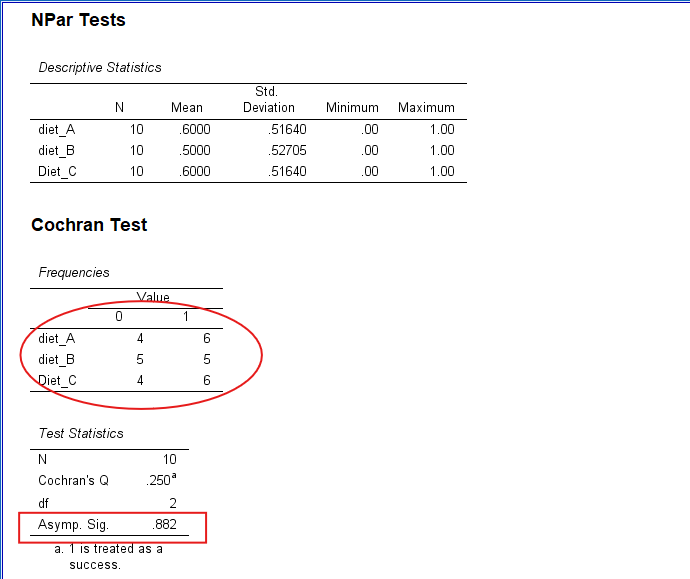
The SPSS output for Cochran’s Q Test includes several key components. Firstly, look at the Test Statistics table, which provides the Cochran’s Q value, degrees of freedom, and the asymptotic significance (p-value). The p-value indicates whether the observed differences between the groups are statistically significant.
Secondly, examine the Crosstabulation table to see the distribution of responses across the different conditions. This table helps in understanding the pattern of responses and identifying which groups differ significantly. If the p-value is less than the chosen significance level (typically 0.05), you reject the null hypothesis and conclude that there are significant differences between the groups.
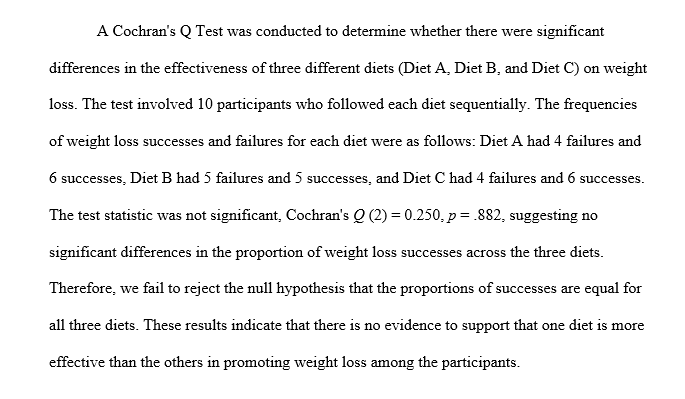
13. How to Report Results of Cochran’s Q Test in APA
Reporting the results of Cochran’s Q Test in APA (American Psychological Association) format requires a structured presentation. Here’s a step-by-step guide in list format:
- Introduction: Begin by describing the purpose of the analysis. Briefly describe the repeated measures data and context.
- Method: Detail the data collection process and the variables involved. Specify that the test ranks all values from both groups combined, then calculates the sum of the ranks for each group to determine Cochran’s Q statistics.
- Results: Present the key statistics from the SPSS output. Include Cochran’s Q value, degrees of freedom, and p-value.
- Discussion: Interpret the results, highlighting the significance of the findings. Explain what the lack of a significant difference means in the context of the research question.
- Conclusion: Summarise the main points of the analysis. Explain the implications of your findings within the context of your study.
Get Help For Your SPSS Analysis
Embark on a seamless research journey with SPSSAnalysis.com, where our dedicated team provides expert data analysis assistance for students, academicians, and individuals. We ensure your research is elevated with precision. Explore our pages;
- SPSS Help by Subjects Area: Psychology, Sociology, Nursing, Education, Medical, Healthcare, Epidemiology, Marketing
- Dissertation Methodology Help
- Dissertation Data Analysis Help
- Dissertation Results Help
- Pay Someone to Do My Data Analysis
- Hire a Statistician for Dissertation
- Statistics Help for DNP Dissertation
- Pay Someone to Do My Dissertation Statistics
Connect with us at SPSSAnalysis.com to empower your research endeavors and achieve impactful data analysis results. Get a FREE Quote Today!