Mann-Whitney U Test in SPSS
Discover the Mann-Whitney U Test in SPSS! Learn how to perform, understand SPSS output, and report results in APA style. Check out this simple, easy-to-follow guide below for a quick read!
Struggling with the Mann-Whitney U Test in SPSS? We’re here to help. We offer comprehensive assistance to students, covering assignments, dissertations, research, and more. Request Quote Now!

1. Introduction
Understanding the intricacies of statistical analysis plays a pivotal role in modern research. Among the various statistical tests, the Mann-Whitney U Test stands out as a nonparametric test often utilised to compare differences between two independent groups. This test is particularly useful when the assumptions required for parametric tests, such as the independent samples t-test, are not met. In this blog post, we will delve into the Mann-Whitney U Test within the context of SPSS, providing a comprehensive guide on its usage, interpretation, and reporting.
By the end of this article, readers will gain a solid understanding of how to perform the Mann-Whitney U Test in SPSS, interpret the results accurately, and report findings according to APA guidelines. Whether you are a novice or an experienced researcher, this guide aims to equip you with the necessary knowledge to effectively apply the Mann-Whitney U Test in your own data analysis projects.
2. What is the Mann-Whitney U Test in Statistics?
The Mann-Whitney U Test serves as a nonparametric alternative to the independent samples t-test. Unlike parametric tests, it does not assume that the data follow a normal distribution. Instead, it compares the ranks of values from two independent groups, making it particularly useful when dealing with ordinal data or when the sample size is small. The test evaluates whether there is a significant difference in the distributions of the two groups.
Firstly, the Mann-Whitney U Test calculates the ranks of all the values from both groups combined. Secondly, it sums the ranks for each group separately and uses these sums to determine the U statistic. This test assesses whether the ranks in one group tend to be higher or lower than the ranks in the other group. As a result, researchers can draw conclusions about the central tendencies and distributions of the two groups being compared.
3. What is the Mann-Whitney U Test used for?
The Mann-Whitney U Test in SPSS serves as a powerful tool for comparing two independent groups, especially when the data do not adhere to the assumptions required for parametric tests. Researchers employ this test across various fields, such as psychology, medicine, and social sciences, to examine differences between groups. For instance, it can be utilised to compare patient outcomes between a treatment group and a control group, or to assess whether two different teaching methods yield significantly different student performances.
Furthermore, the Mann-Whitney U Test is invaluable when dealing with ordinal data or continuous data that are not normally distributed. By leveraging SPSS’s capabilities, users can efficiently handle large datasets and complex analyses, ensuring accurate results. This test helps researchers draw meaningful conclusions about their data, even when traditional parametric methods are unsuitable, thereby enhancing the robustness and reliability of their findings.
4. What is the Mann-Whitney U Test in SPSS?
The Mann-Whitney U Test in SPSS involves a straightforward procedure to compare the ranks of two independent samples. Firstly, users input their data into SPSS and select the Mann-Whitney U Test from the nonparametric tests menu. SPSS then ranks all the values from both groups combined and calculates the sum of the ranks for each group. These rank sums form the basis for computing the U statistic.
Secondly, SPSS provides the U statistic along with a p-value, which indicates whether the observed difference in ranks between the two groups is statistically significant. A low p-value (typically less than 0.05) suggests a significant difference in the distributions of the two groups. This process allows researchers to make informed decisions based on their data, even when traditional parametric assumptions do not hold.
5. What is the difference between the Independent Sample t-test and the Mann-Whitney U Test?
The independent samples t-test and the Mann-Whitney U Test both compare differences between two independent groups, but they differ significantly in their assumptions and applications. Firstly, the independent samples t-test assumes that the data are normally distributed and have equal variances across groups. This parametric test compares the means of the two groups to determine if there is a significant difference.

In contrast, the Mann-Whitney U Test does not require normality or homogeneity of variance, making it a nonparametric alternative. Instead of comparing means, it evaluates the ranks of the data, making it suitable for ordinal data or continuous data that are not normally distributed. Therefore, researchers opt for the Mann-Whitney U Test when their data do not meet the stringent assumptions required for the t-test, ensuring a more flexible and robust analysis.
6. What Are Other Nonparametric Tests?
- Mann-Whitney U Test: Compares differences between two independent groups when the data are not normally distributed.
- Kruskal-Wallis Test: Extends the Mann-Whitney U Test to more than two groups, assessing rank differences—nonparametric alternative to One-Way ANOVA Test.
- Wilcoxon Signed-Rank Test: Compares two related samples or repeated measurements on a single sample to assess differences in their ranks.
- McNemar Test: Used for paired nominal data to determine changes in proportions.
- Friedman Test: Nonparametric alternative to repeated measures ANOVA, comparing ranks across multiple related groups.
- Sign Test: Evaluates the median of a single sample or compares medians of two related samples.
- Cochran’s Q Test: Extension of the McNemar test for more than two related groups.
- Kendall’s W: Assesses the agreement between raters.
- Binomial Test: Tests the observed proportion against a theoretical proportion.
- Jonckheere-Terpstra Test: Tests for ordered differences among groups.
- Wald-Wolfowitz Runs Test: Evaluates the randomness of a sequence.
- Marginal Homogeneity Test: Assesses changes in proportions in paired categorical data.
- Median Test: Compares the medians of two or more groups.
7. What are the Assumptions of the Mann-Whitney U Test in SPSS?
- Independence: The two samples must be independent of each other.
- Measurement Scale: The dependent variable should be ordinal or continuous.
- Group Categorisation: The independent variable should consist of two categorical, independent groups.
- Independent Observations: Observations within each group must be independent.
- Distribution Shape: The distributions of the two groups should have the same shape.
8. What is the Hypothesis of the Mann-Whitney U Test in SPSS?
The Mann-Whitney U Test operates under two hypotheses.
- The null hypothesis (H0): there is no difference in the distribution of the two groups.
- The alternative hypothesis (H1): There is a significant difference in the distributions of the two groups
Rejecting the null hypothesis in favour of the alternative suggests that the two groups differ in a meaningful way.
9. An Example of the Mann-Whitney U Test in SPSS
Consider a study aiming to compare the test scores of two independent groups of students: those who received traditional classroom instruction and those who participated in online learning. To perform the Mann-Whitney U Test in SPSS, input the test scores for both groups into the software. Select the Mann-Whitney U Test from the nonparametric tests menu and run the analysis.
The SPSS output will include the U statistic and a p-value. If the p-value is less than 0.05, we reject the null hypothesis, indicating a significant difference in test scores between the two groups. This result would suggest that the mode of instruction impacts student performance, providing valuable insights for educators and policymakers.
Step by Step: Running the Mann-Whitney U Test in SPSS Statistics
Let’s embark on a step-by-step guide on performing the Mann-Whitney U Test using SPSS
- Input Data: Enter the data into SPSS, ensuring that the dependent variable (e.g., test scores) and the independent variable (e.g., group type) are correctly labelled.
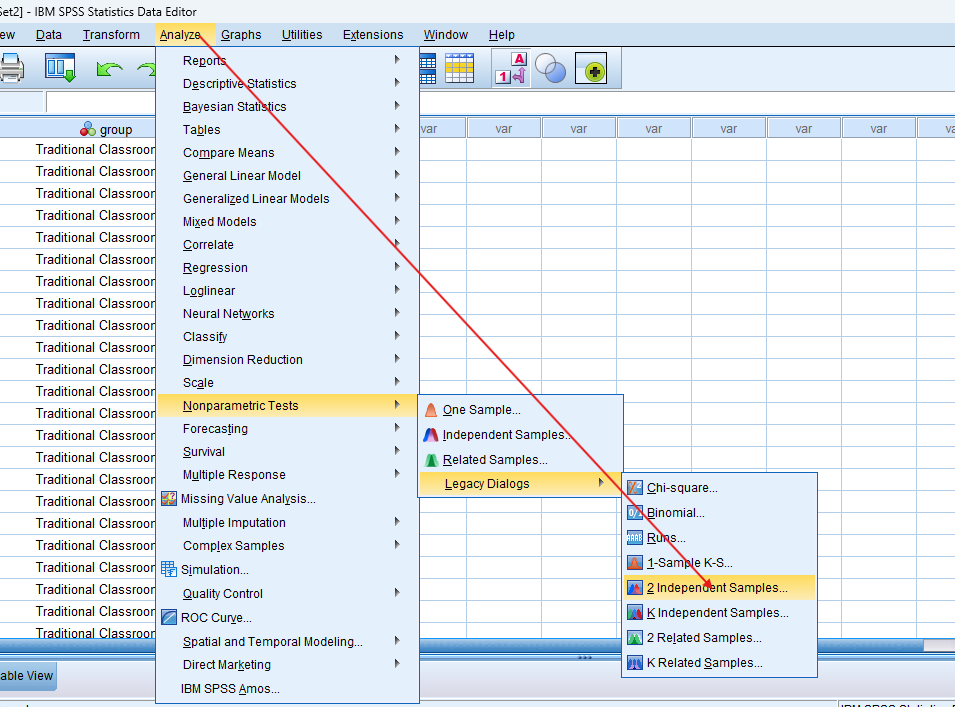
- Select the Test: Navigate to ‘Analyze’ > ‘Nonparametric Tests’ > ‘Legacy Dialogs’ > ‘2 Independent Samples’.
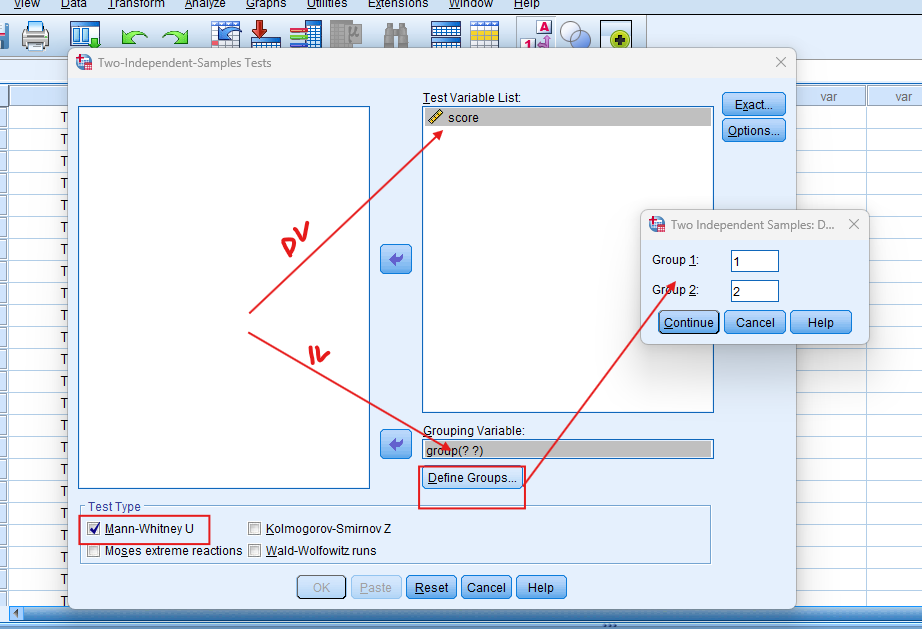
- Choose Variables: Select the dependent variable for ‘Test Variable List’ and the independent variable for ‘Grouping Variable’. Define the groups appropriately.
- Run the Test: Click ‘OK’ to run the Mann-Whitney U Test.
- Interpret Output: SPSS will provide the U statistic, Z score, and p-value. A p-value less than 0.05 indicates a significant difference between the groups.
Note: Conducting the Mann-Whitney U Test in SPSS provides a robust foundation for understanding the key features of your data. Always ensure that you consult the documentation corresponding to your SPSS version, as steps might slightly differ based on the software version in use. This guide is tailored for SPSS version 25, and for any variations, it’s recommended to refer to the software’s documentation for accurate and updated instructions.
11. SPSS Output for Mann-Whitney U Test

12. How to Interpret SPSS Output of Mann-Whitney U Test
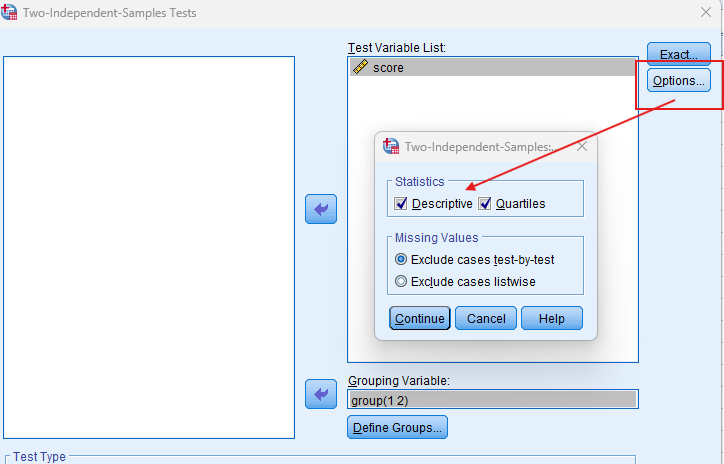
The SPSS output for the Mann-Whitney U Test typically includes several key tables, including Descriptive Statistics, Ranks, Test Statistics Tables
- The ranks table displays the mean ranks for each group, helping to understand the direction of any differences.
- The Test Statistics table provides the U statistic, Z score, and p-value. The p-value determines the significance of the results.
If the p-value is less than 0.05, it suggests a significant difference in the distributions of the two groups. Researchers should then examine the mean ranks to understand which group tends to have higher or lower values. Additionally, the Z score offers insight into the magnitude of the difference between groups. Together, these elements enable a comprehensive interpretation of the test results.
13. How to Report Results of Mann-Whitney U Test in APA
Reporting the results of Mann Whitney u Test in APA (American Psychological Association) format requires a structured presentation. Here’s a step-by-step guide in list format:
- Introduction: Begin by describing the purpose of the analysis. The Mann-Whitney U Test aims to determine whether there is a significant difference between two independent groups when the data do not meet the assumptions required for parametric tests.
- Method: Detail the data collection process and the variables involved. Specify that the test ranks all values from both groups combined, then calculates the sum of the ranks for each group to determine the U statistic. Mention the grouping variable and the dependent variable used in the test.
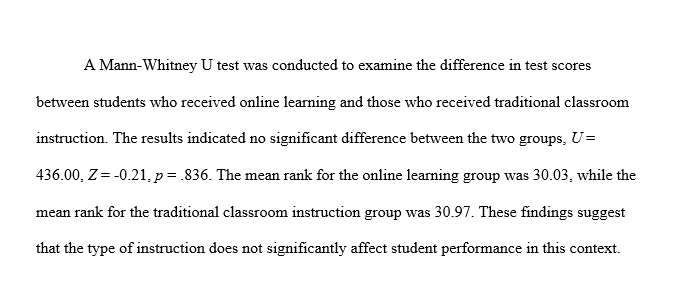
- Results: Present the key statistics from the SPSS output. Report the U statistic, Z score, and the asymptotic significance (p-value).
- Discussion: Interpret the results, highlighting the significance of the findings. Explain what the lack of a significant difference means in the context of the research question.
- Conclusion: Summarise the main points of the analysis. Reinforce the finding that there was no significant difference between the groups. Suggest potential areas for further research, such as examining other factors that might influence student performance or using larger sample sizes for increased power.
Get Help For Your SPSS Analysis
Embark on a seamless research journey with SPSSAnalysis.com, where our dedicated team provides expert data analysis assistance for students, academicians, and individuals. We ensure your research is elevated with precision. Explore our pages;
- SPSS Help by Subjects Area: Psychology, Sociology, Nursing, Education, Medical, Healthcare, Epidemiology, Marketing
- Dissertation Methodology Help
- Dissertation Data Analysis Help
- Dissertation Results Help
- Pay Someone to Do My Data Analysis
- Hire a Statistician for Dissertation
- Statistics Help for DNP Dissertation
- Pay Someone to Do My Dissertation Statistics
Connect with us at SPSSAnalysis.com to empower your research endeavors and achieve impactful data analysis results. Get a FREE Quote Today!