Univariate Analysis of Variance in SPSS
Discover Univariate Analysis of Variance in SPSS! Learn how to perform, understand SPSS output, and report results in APA style. Check out this simple, easy-to-follow guide below for a quick read!
Struggling with the ANOVA Test in SPSS? We’re here to help. We offer comprehensive assistance to students, covering assignments, dissertations, research, and more. Request Quote Now!
Introduction
Welcome to our exploration of the Univariate Analysis of Variance Analysis, a statistical method that unlocks valuable insights when comparing means across multiple groups. Whether you’re a student engaged in a research project or a seasoned researcher investigating diverse populations, the One-Way ANOVA Test proves indispensable in discerning if there are significant differences among group means. In this blog post, we’ll traverse the fundamentals of the Univariate Analysis, from its definition to the practical application using SPSS. By the end, you’ll possess not only a solid theoretical understanding but also the practical skills to conduct and interpret this powerful statistical analysis.
What is the Univariate Analysis?
ANOVA stands for Analysis of Variance, and the “One-Way” denotes a scenario where there is a single independent variable with more than two levels or groups. Essentially, this test assesses whether the means of these groups are significantly different from each other. It’s a robust method for scenarios like comparing the performance of students in multiple teaching methods or examining the impact of different treatments on a medical condition. The One-Way ANOVA Test yields valuable insights into group variations, providing researchers with a statistical lens to discern patterns and make informed decisions. Now, let’s delve deeper into the assumptions, hypotheses, and the step-by-step process of conducting the One-Way ANOVA Test in SPSS.
Assumption of the One-Way ANOVA Test
Before delving into the intricacies of the One-Way ANOVA Test, let’s outline its critical assumptions:
- Normality: The dependent variable should be approximately normally distributed within each group.
- Homogeneity of Variances: The variances of the groups being compared should be approximately equal. This assumption is crucial for the validity of the test.
- Independence: Observations within each group must be independent of each other.
Adhering to these assumptions ensures the reliability of the One-Way ANOVA Test results, providing a strong foundation for accurate statistical analysis.
Hypothesis of the Univariate Analysis of Variance (ANOVA) Test
Moving on to the formulation of hypotheses in the One-Way ANOVA Test,
- The null hypothesis (H0): There is no significant difference in the means of the groups.
- The alternative hypothesis (H1): there is a significant difference in the means of the groups.
Clear and specific hypotheses are crucial for the subsequent statistical analysis and interpretation.
Post-Hoc Tests for ANOVA
While the One-Way ANOVA is powerful in detecting overall group differences, it doesn’t provide specific information on which pairs of groups differ significantly. Post-hoc tests become essential in this context to conduct pairwise comparisons and identify the specific groups responsible for the observed overall difference. Without post-hoc tests, researchers might miss crucial nuances in the data, leading to incomplete or inaccurate interpretations.
Here are commonly used Post-hoc Tests for One-Way ANOVA:
- Tukey’s Honestly Significant Difference (HSD): Ideal when there are equal sample sizes and variances across groups. It controls the familywise error rate, making it suitable for multiple comparisons.
- Bonferroni Correction: Helpful when conducting numerous comparisons. It’s more conservative, adjusting the significance level to counteract the increased risk of Type I errors.
- Scheffe Test: Useful for unequal sample sizes and variances. It’s more robust but might be conservative in some situations.
- Dunnett’s Test: Designed for comparing each treatment group with a control group. It’s suitable for situations where there is a control group and multiple treatment groups.
- Games-Howell Test: Useful when sample sizes and variances are unequal across groups. It’s a robust option for situations where assumptions of homogeneity are not met.
Choosing the appropriate post-hoc test depends on the characteristics of your data and the specific research context. Consider factors such as sample sizes, homogeneity of variances, and the number of planned comparisons when deciding on the most suitable post-hoc test for your One-Way ANOVA results.
Example of Univariate Analysis of Variance Analysis
To illustrate the practical application of the One-Way ANOVA Test, let’s consider a hypothetical scenario. Imagine you’re studying the effectiveness of different fertilizers on the growth of plants. You have three groups, each treated with a different fertilizer.
- The null hypothesis: there’s no significant difference in the mean plant growth across the three fertilizers.
- The alternative hypothesis: there is a significant difference in the mean plant growth across the three fertilizers.
By conducting the One-Way ANOVA Test, you can statistically evaluate whether the observed differences in plant growth are likely due to the different fertilizers’ effectiveness or if they could occur by random chance alone. This example demonstrates how the One-Way ANOVA Test can be a valuable tool in diverse fields, providing insights into the impact of various factors on the dependent variable.
How to Perform Univariate Analysis of Variance in SPSS


Step by Step: Running ANOVA Test in SPSS Statistics
Let’s delve into the step-by-step process of conducting the univariate analysis using SPSS. Here’s a step-by-step guide on how to perform Univariate Analysis of Variance in SPSS:
- STEP: Load Data into SPSS
Commence by launching SPSS and loading your dataset, which should encompass the variables of interest – a categorical independent variable. If your data is not already in SPSS format, you can import it by navigating to File > Open > Data and selecting your data file.
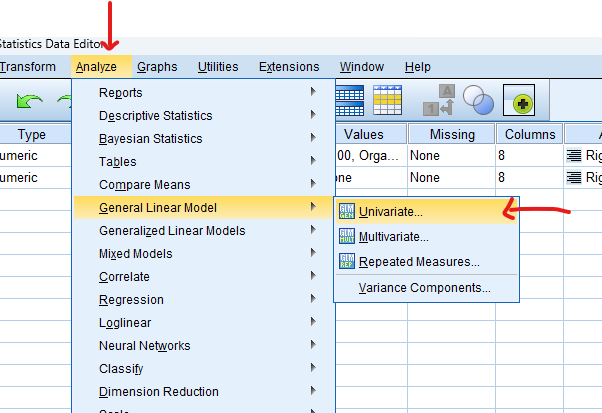
- STEP: Access the Analyze Menu
In the top menu, locate and click on “Analyze.” Within the “Analyze” menu, navigate to “General Linear Model” and choose ” Univariate.” Analyze > General Linear Model> Univariate
- STEP: Specify Variables
In the dialogue box, move the dependent variable to the “Dependent Variable” field. Move the variable representing the group or factor to the “Fixed Factor (s)” field. This is the independent variable with different levels or groups.
- STEP: Plots Post-Hoc Test
Click on the “Plot” button, Move to Facto into the Horizontal Axis, and then click the “Add” button.
Go on the “Post Hoc” button, Check “Tukey” and Adjust as per your analysis requirements.
- STEP: Options
Snap on the “Options” button Check “Descriptive”, “Homogeneity Test” and “Estimates of effect size”
- STEP: Generate SPSS Output
Once you have specified your variables and chosen options, click the “OK” button to perform the analysis. SPSS will generate a comprehensive output, including the requested frequency table and chart for your dataset.
Note
Conducting a One-Way ANOVA test in SPSS provides a robust foundation for understanding the key features of your data. Always ensure that you consult the documentation corresponding to your SPSS version, as steps might slightly differ based on the software version in use. This guide is tailored for SPSS version 25, and for any variations, it’s recommended to refer to the software’s documentation for accurate and updated instructions.


How to Interpret SPSS Output of Univariate Analysis
SPSS will generate output, including descriptive statistics, the f value, degrees of freedom, and the p-value and post-hoc
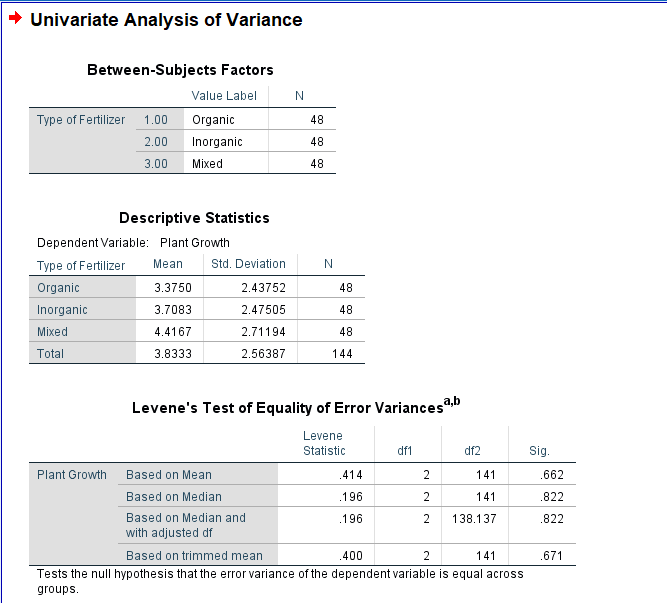
Descriptives Table
- Mean and Standard Deviation: Evaluate the means and standard deviations of each group. This provides an initial overview of the central tendency and variability within each group.
- Sample Size (N): Confirm the number of observations in each group. Discrepancies in sample sizes could impact the interpretation.
- 95% Confidence Interval (CI): Review the confidence interval for the mean difference.
Test of Homogeneity of Variances Table
- Levene’s Test: In the Test of Homogeneity of Variances table, look at Levene’s Test statistic and associated p-value. This test assesses whether the variances across groups are roughly equal. A non-significant p-value suggests that the assumption of homogeneity of variances is met.
ANOVA Table
- Between-Groups and Within-Groups Variability: Move on to the ANOVA table, which displays the Between-Groups and Within-Groups sums of squares, degrees of freedom, mean squares, the F-ratio, and the p-value.
- F-Ratio: Focus on the F-ratio. A higher F-ratio indicates larger differences among group means relative to within-group variability.
- Degrees of Freedom: Note the degrees of freedom for Between-Groups and Within-Groups. These values are essential for calculating the critical F-value.
- P-Value: Examine the p-value associated with the F-ratio. If the p-value is below your chosen significance level (commonly 0.05), it suggests that at least one group’s mean is significantly different.
Post Hoc Tests Table
- Specific Group Differences: If you conducted post-hoc tests, examine the results. Look for significant differences between specific pairs of groups. Pay attention to p-values and confidence intervals to identify which groups are significantly different from each other.
Effect Size Measures
- Eta-squared: If available, consider effect size measures in the ANOVA table. Eta-squared indicates the proportion of variance in the dependent variable explained by the group differences.
How to Report Results of One-Way ANOVA Test in APA
Reporting the results of a One-Way ANOVA Test in APA style ensures clarity and adherence to established guidelines. Begin with a concise description of the analysis conducted, including the test name, the dependent variable, and the independent variable representing the groups.
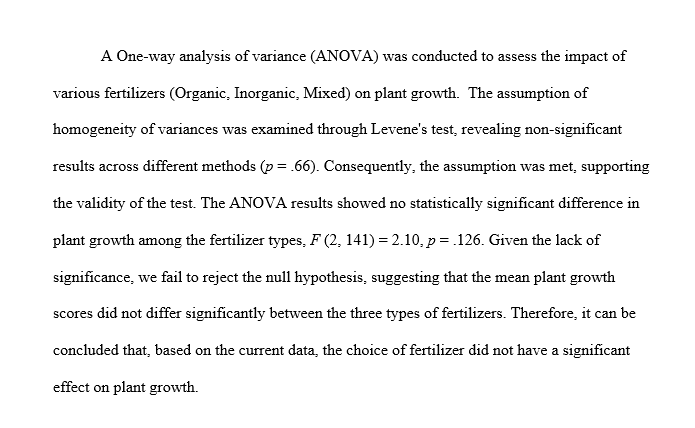
For instance, “A One-Way Analysis of Variance (ANOVA) was conducted to examine the differences in plant growth across different fertilizers.”
Present the key statistical findings from the ANOVA table, including the F-ratio, degrees of freedom, and p-value. For example, “The results revealed a significant difference in plant growth among the fertilizers, F(df_between, df_within) = [F-ratio], p = [p-value].”
If the p-value is significant, proceed with post-hoc tests (e.g., Tukey’s HSD) to pinpoint specific group differences. Additionally, report effect size measures to provide a comprehensive overview of the results.
Conclude the report by summarising the implications of the findings in relation to your research question or hypothesis. This structured approach to reporting One-Way ANOVA results in APA format ensures transparency and facilitates the understanding of your research outcomes.
Get Help For Your SPSS Analysis
Embark on a seamless research journey with SPSSAnalysis.com, where our dedicated team provides expert data analysis assistance for students, academicians, and individuals. We ensure your research is elevated with precision. Explore our pages;
- SPSS Data Analysis Help – SPSS Helper,
- Quantitative Analysis Help,
- Qualitative Analysis Help,
- SPSS Dissertation Analysis Help,
- Dissertation Statistics Help,
- Statistical Analysis Help,
- Medical Data Analysis Help.
Connect with us at SPSSAnalysis.com to empower your research endeavors and achieve impactful results. Get a Free Quote Today!