Survival Analysis in SPSS
Discover Survival Analysis in SPSS! Learn how to perform, understand SPSS output, and report results in APA style. Check out this simple, easy-to-follow guide below for a quick read!
Struggling with Survival Analysis in SPSS? We’re here to help. We offer comprehensive assistance to students, covering assignments, dissertations, research, and more. Request Quote Now!
1. Introduction
Survival analysis is a critical method in statistics, particularly for analysing the time until an event occurs. In medical research, this event often refers to the occurrence of death or disease progression, while in other fields, it could relate to equipment failure or customer churn. Understanding survival analysis can help researchers predict outcomes based on various covariates.
In this blog post, we will dive deep into survival analysis using SPSS, exploring its usage, assumptions, and how to perform and interpret the results. By the end of this guide, you will gain insights into how to conduct survival analysis and report findings according to APA guidelines.
Time-To-Event (TTE) Data Analysis
Time-to-event (TTE) data analysis, also known as survival analysis, focuses on the time duration until a particular event of interest occurs. In medical research, this event is often death, relapse, or recovery, while in other fields, it could involve equipment failure, customer churn, or time to purchase. TTE data is unique because it allows researchers to account for both completed events and censored data, where the event has not yet occurred or the subject leaves the study before the event happens.
TTE data analysis is crucial because it enables researchers to estimate the probability of an event occurring at different times and to compare survival times across different groups. The analysis incorporates statistical models like the Kaplan-Meier estimator and Cox proportional hazards model to handle censored data and multiple covariates. This makes TTE analysis a powerful tool for answering questions about treatment effectiveness, risk factors, and overall survival outcomes in a given population.
2. What is Survival Analysis in Statistics?
Survival analysis is a statistical technique designed to analyse data where the outcome variable is the time until an event occurs. Unlike other analyses, it handles censored data, which occurs when the event of interest hasn’t happened for all subjects during the study period. This unique feature makes survival analysis vital in various research areas, especially in medical and engineering fields.
Firstly, survival analysis helps researchers model and predict the likelihood of an event occurring at different times. Secondly, it provides tools to compare survival times between different groups, allowing for a deeper understanding of how variables like treatment or demographic factors affect outcomes.
3. What is Survival Analysis used for?
Researchers widely use survival analysis to study time-to-event data across numerous fields. In healthcare, it plays a key role in predicting patient survival times and understanding factors that influence outcomes like disease remission or death. By using survival analysis, medical professionals can evaluate the effectiveness of new treatments or interventions.
Outside healthcare, survival analysis finds applications in engineering, where it helps estimate the lifespan of products or machinery. It is also commonly used in marketing to predict customer churn rates and identify factors that influence customer retention, making it a versatile tool across industries.
4. Explaining the Differences Between Survival Analysis, Kaplan-Meier, Cox Regression, and ROC Curve
- Survival Analysis:
- A statistical method used to analyse the time until an event occurs, particularly in medical, engineering, and social sciences.
- Includes several techniques to handle censored data and compare survival times between groups.
- Kaplan-Meier:
- A non-parametric method that estimates survival probabilities over time.
- It produces a survival curve and is useful for visualising the probability of survival at different time points.
- Commonly used to compare survival between two or more groups.
- Cox Regression (Proportional Hazards Model):
- A semi-parametric model used to assess the effect of several covariates on survival time.
- It estimates hazard ratios to determine how variables impact the risk of the event occurring.
- ROC Curve:
- A graphical plot used to assess the accuracy of diagnostic tests, focusing on sensitivity and specificity.
- Though not specifically for survival data, it can be used in survival analysis to identify optimal cut-off points for predictors.
5. What are the Assumptions of the Survival Analysis?
Before conducting survival analysis, it is crucial to meet certain assumptions to ensure accurate results. These assumptions are essential for models like Kaplan-Meier and Cox Regression. By understanding and verifying these assumptions, researchers can make sure their findings are valid and reliable. Here are the key assumptions of survival analysis:
- Independence of survival times between subjects.
- The event of interest is clearly defined.
- Proportional hazards assumption for Cox models.
- Censoring is non-informative (i.e., unrelated to the outcome of interest).
- Events happen independently of one another.
- There are no ties in the event times.
6. What is the Hypothesis of the Survival Analysis?
In survival analysis, the null hypothesis typically states that there is no difference in survival between different groups or covariates. For example, in medical research, the null hypothesis might claim that two treatments have identical survival rates over time. Conversely, the alternative hypothesis suggests that at least one group or covariate influences survival differently.
Testing these hypotheses helps researchers determine if factors such as treatment, age, or gender significantly affect the event’s timing. Rejecting the null hypothesis usually indicates that the survival times vary between groups or are influenced by particular covariates.
7. An Example of the Survival Analysis
Let’s consider a clinical study where researchers want to compare the survival rates of patients receiving a new treatment versus a standard treatment. The main variables involved are time to event, which measures the duration (in months) until the event (e.g., death or relapse) occurs, and event, which is coded as 1 if the event occurred and 0 if the patient was censored (i.e., the event did not occur during the study). Additionally, the patients are divided into two groups: those receiving the new treatment (coded as 1) and those receiving the standard treatment (coded as 0).
The Key variables:
- Time-to-Event Variable: This represents the time in months until the event occurs (e.g., death, relapse) or until the study ends (if censored).
- Event Variable: The event is coded as 1 if the event occurred (e.g., the patient experienced death or relapse) and 0 if the patient is censored (e.g., the event didn’t happen during the study).
- Treatment Group Variable: This categorical variable indicates whether the patient received the new treatment (coded as 1) or the standard treatment (coded as 0).
For this example, researchers use Kaplan-Meier survival analysis to estimate and compare the survival probabilities over time between the two treatment groups. The Kaplan-Meier method allows the estimation of survival functions even when some data points are censored, making it an ideal tool for this type of study. In this scenario, the researchers are particularly interested in determining whether the new treatment significantly improves the patients’ chances of survival compared to the standard treatment.

Step by Step: Running Survival Analysis in SPSS Statistics
Let’s embark on a step-by-step guide on performing the Survival Analysis using SPSS
- STEP: Load Data into SPSS
Commence by launching SPSS and loading your dataset, which should encompass the variables of interest – a categorical independent variable. If your data is not already in SPSS format, you can import it by navigating to File > Open > Data and selecting your data file.
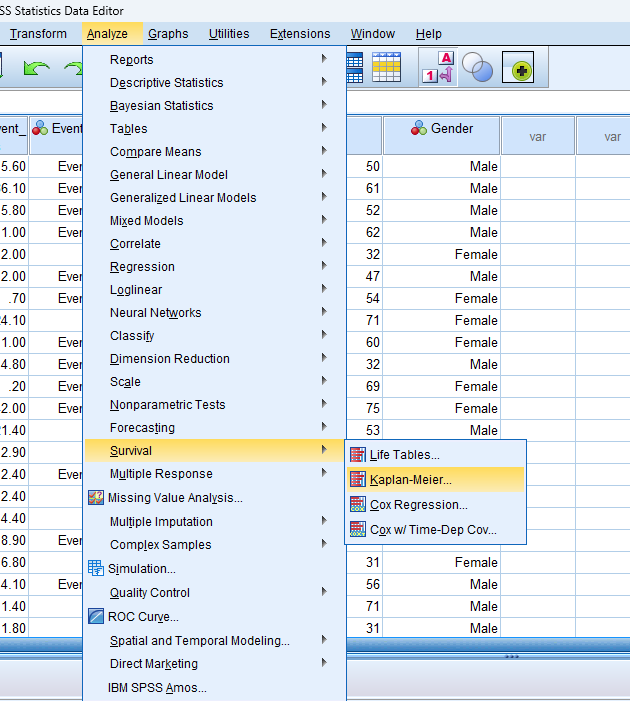
- STEP: Access the Analyze Menu
In the top menu, Go to ‘Analyse’ > ‘Survival’ > select either ‘Kaplan-Meier’ or ‘Cox Regression’ based on your objective.
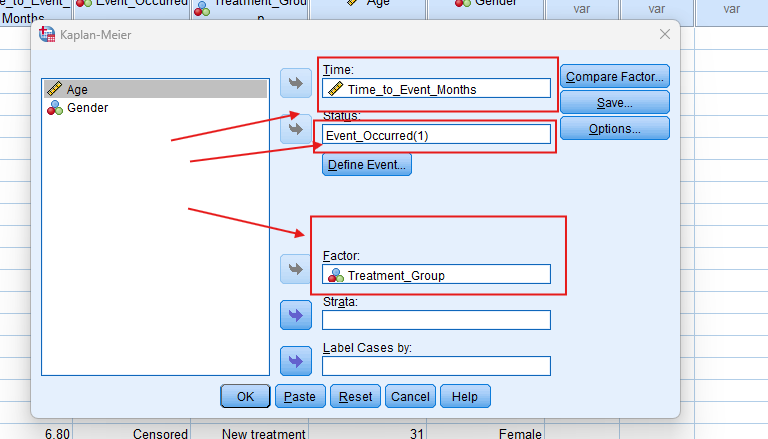
- STEP: Specify Variables
- For Kaplan-Meier, select the time and event variables, and include any grouping variable (e.g., treatment group).
- For Cox Regression, specify time, event, and covariates to be included in the model.
- STEP: Generate SPSS Output
- Click ‘OK’ after selecting your variables and method. SPSS will run the analysis and generate output tables and survival curves.
Note: Conducting Survival Analysis in SPSS provides a robust foundation for understanding the key features of your data. Always ensure that you consult the documentation corresponding to your SPSS version, as steps might slightly differ based on the software version in use. This guide is tailored for SPSS version 25, and for any variations, it’s recommended to refer to the software’s documentation for accurate and updated instructions.
SPSS Output for Survival Analysis
9. How to Interpret SPSS Output of Survival Analysis
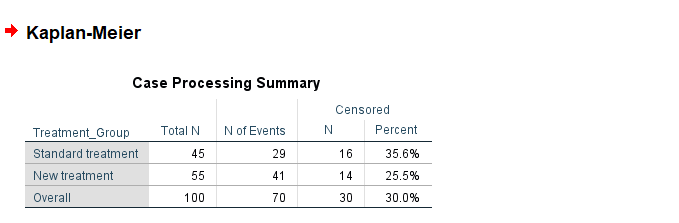
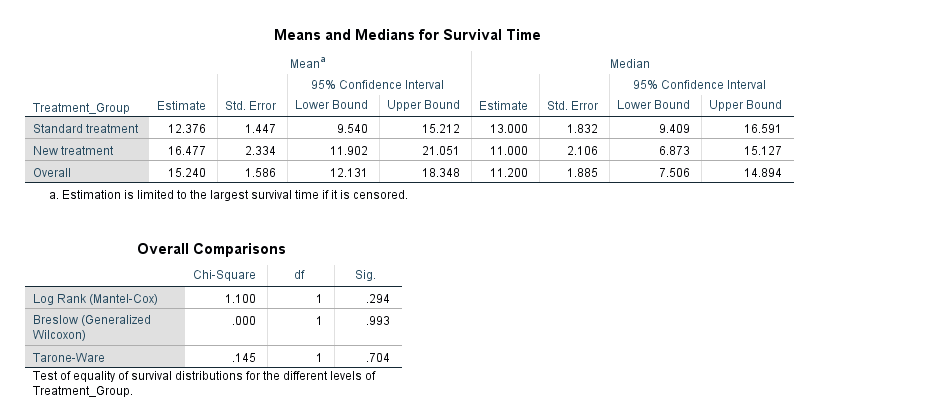
SPSS will generate output, including Case Processing Summary, Survival Table, Means and MEdian Survival Time, Overall comparison and Survival Function Plot
- Kaplan-Meier Output:
- Survival Table/Life Table: Shows the number of events and censored cases at each time point.
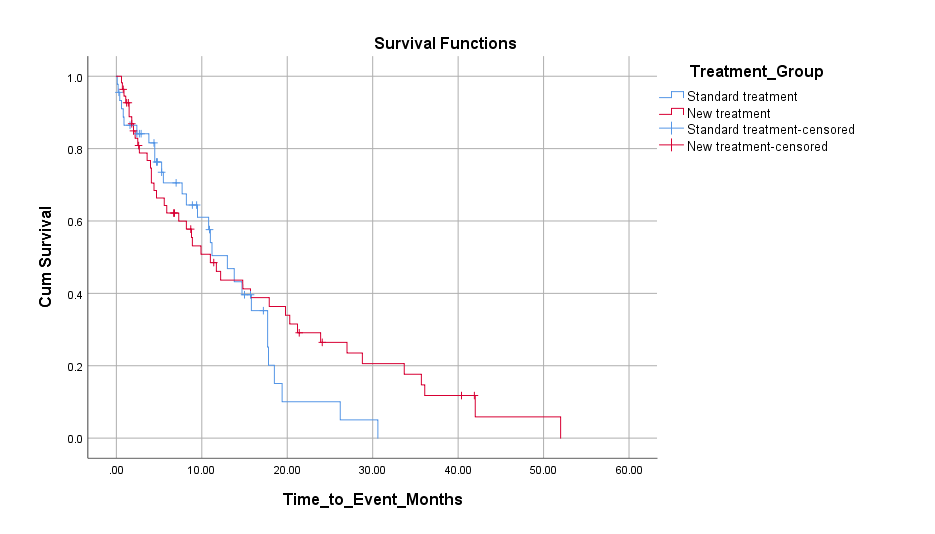
- Survival Function Plot: Provides the estimated survival probability over time. Look at the steep drops to see where the highest event rates occur.
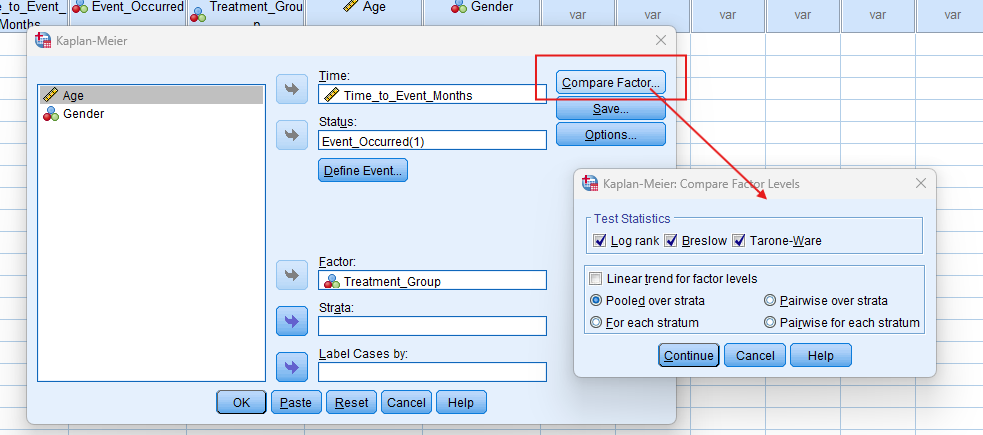
- Log-Rank Test Table: Compares survival curves between groups and provides a p-value to determine significance. If p < 0.05, there is a significant difference between groups.
- Cox Regression Output:
- Model Summary: Reports the overall model fit, including -2 Log Likelihood, AIC, and BIC.
- Covariate Table: Displays hazard ratios (HR) for each covariate, with confidence intervals. An HR > 1 means increased risk, while HR < 1 means reduced risk.
- Proportional Hazards Test: Confirms whether the proportional hazards assumption holds (important for valid results).
10. How to Report Results of Survival Analysis in APA
Reporting the results of survival Analysis in APA (American Psychological Association) format requires a structured presentation. Here’s a step-by-step guide in list format:
- Introduction: Briefly describe the purpose of the analysis and the theoretical background.
- Method: Detail the data collection process, variables used, and the model specified.
- Results: Present the parameter estimates with their standard errors, and significance levels.
- Figures and Tables: Include relevant plots and tables, ensuring they are properly labelled and referenced.
- Discussion: Interpret the results, highlighting the significance of the findings and their implications.
- Conclusion: Summarise the main points and suggest potential areas for further research.

Get Support For Your SPSS Data Analysis
Embark on a seamless research journey with SPSSAnalysis.com, where our dedicated team provides expert data analysis assistance for students, academicians, and individuals. We ensure your research is elevated with precision. Explore our pages;
- Biostatistical Modeling Expert
- Statistical Methods for Clinical Studies
- Epidemiological Data Analysis
- Biostatistical Support for Researchers
- Clinical Research Data Analysis
- Medical Data Analysis Expert
- Biostatistics Consulting
- Healthcare Data Statistics Consultant
- SPSS Help by Subjects Area: Psychology, Sociology, Nursing, Education, Medical, Healthcare, Epidemiology, Marketing
Connect with us at SPSSAnalysis.com to empower your research endeavors and achieve impactful data analysis results. Get a FREE Quote Today!