Power Analysis for a One-Sample t-Test in SPSS
Discover Power Analysis for a One-Sample t-Test in SPSS! Learn how to perform, understand SPSS output, and report results in APA style. Check out this simple, easy-to-follow guide below for a quick read!
Struggling with Power Analysis in SPSS? We’re here to help. We offer comprehensive assistance to students, covering assignments, dissertations, research, and more. Request Quote Now!
1. Introduction
Power analysis is an essential step for ensuring that your study is statistically sound and capable of detecting meaningful effects. In SPSS, conducting a power analysis for a one-sample t-test allows you to determine either the required sample size or the power you can achieve with your planned sample. This tutorial provides a detailed, step-by-step guide on how to perform, interpret, and report a power analysis for a one-sample t-test in SPSS. Researchers, dissertation students, and academic authors can use this resource as a practical reference.
👉 You can visit our guide on How to Perform a One-Sample t-Test in SPSS to learn how to conduct the test step by step and report findings in APA.
2. What is a One-Sample t-Test?
A one-sample t-test is used when you have one sample and want to test whether its mean differs significantly from a known or hypothesized population mean. It is a common inferential statistic in experimental research, clinical studies, and quality control processes.
2.1 Hypotheses of a One-Sample t-Test
The hypotheses structure for a one-sample t-test is straightforward:
- Null Hypothesis (H₀): The sample mean is equal to the population mean (µ = µ₀).
- Alternative Hypothesis (H₁): The sample mean is not equal to the population mean (µ ≠ µ₀).
This test can be two-tailed or one-tailed, depending on whether you predict a difference in a specific direction.
2.2 Assumptions
Before using a one-sample t-test, ensure your data meet these assumptions:
- The dependent variable is continuous (interval or ratio).
- The observations are independent.
- The data are approximately normally distributed.
If the normality assumption is violated in small samples, consider non-parametric alternatives.
3. How to Calculate Power Analysis for a One-Sample t-Test
Power analysis quantifies the probability of correctly rejecting the null hypothesis when it is false. To calculate power for a one-sample t-test, you need:
- Effect size (Cohen’s d): Indicates the standardized difference between the sample mean and population mean.
Formula: d = (µ₁ – µ₀) / σ
- Alpha level (α): Probability of Type I error (commonly 0.05).
- Desired power (1 – β): Probability of correctly rejecting a false null hypothesis (commonly 0.80).
- Sample size (N): Either determine power given N, or find required N for desired power.
These elements are linked mathematically, but in practice, SPSS automates the computation.
4. Example of Power Analysis for a One-Sample t-Test
Imagine a psychology researcher wants to test whether a mindfulness training program affects participants’ stress levels compared to the known average in the general population. Instead of specifying an exact mean difference, the researcher decides to use an expected effect size based on previous research findings.
Parameters for this example:
Expected effect size (Cohen’s d): 0.50 (medium effect)
Significance level (α): 0.05 (two-tailed)
Desired power (1−β): 0.80
5. How to Perform Power Analysis for a One-Sample t-Test in SPSS
Step by Step: Running Power Analysis of One Sample Test in SPSS Statistics
Let’s embark on a step-by-step guide on performing the power analysis using SPSS
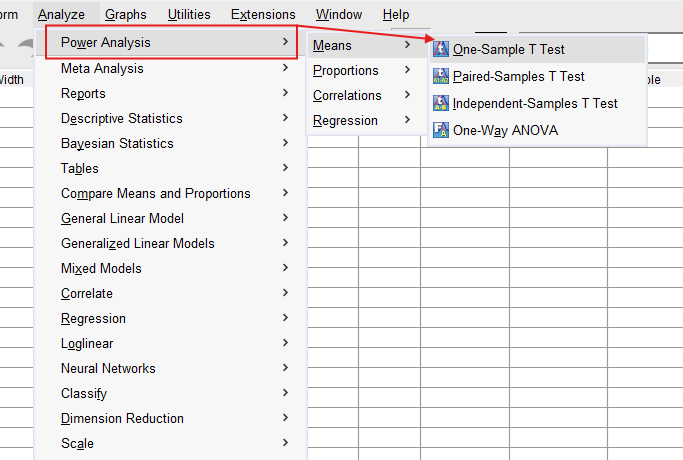
1. Step: Open the Power Analysis Menu: Navigate to Analyze > Power Analysis > Means > One-Sample t-Test.
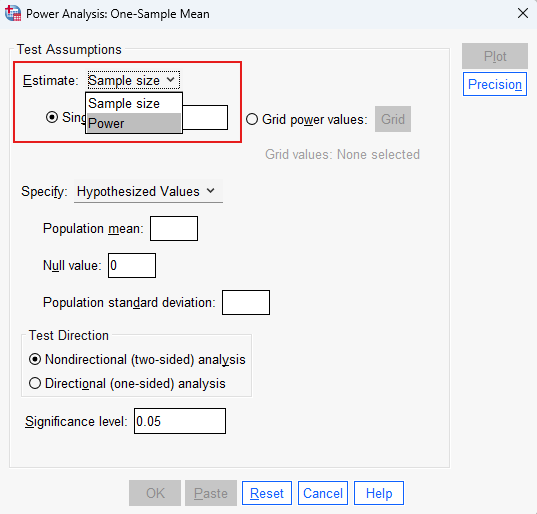
2. Step: Choose What to Estimate: In the Test Assumptions dialog box, look for the Estimate dropdown. Choose either Sample size (to calculate how many participants you need) or Power (to find out the power with your current sample size)
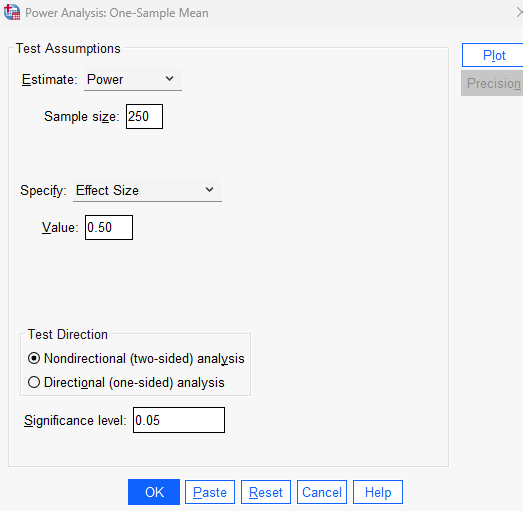
3. Step: Specify the Effect Size: Under Specify, choose Effect Size instead of raw means. Enter the expected Cohen’s d (for example, 0.50 for a medium effect).
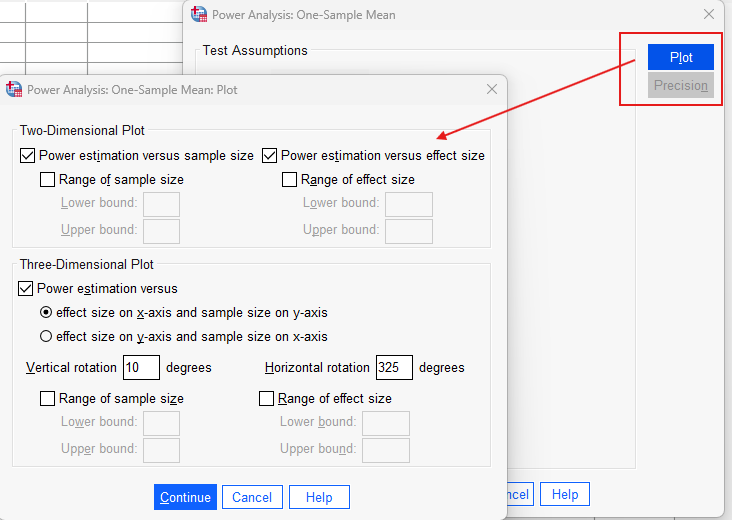
4. Step: Generate a Plot: Click the Plot button
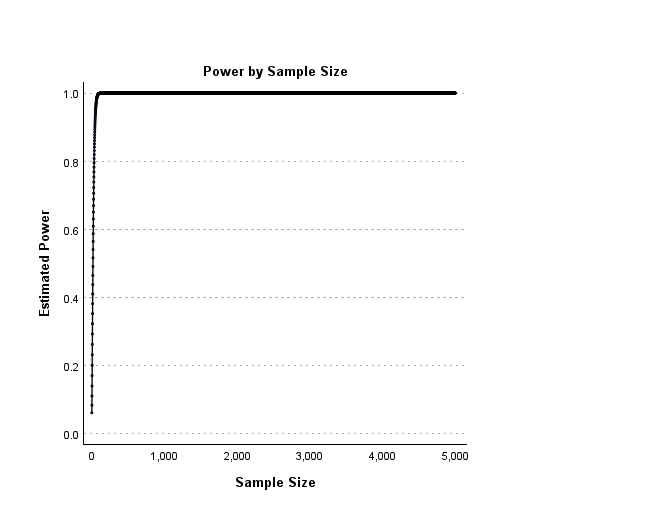
Tick Power estimation versus sample size to see how power changes as sample size changes.
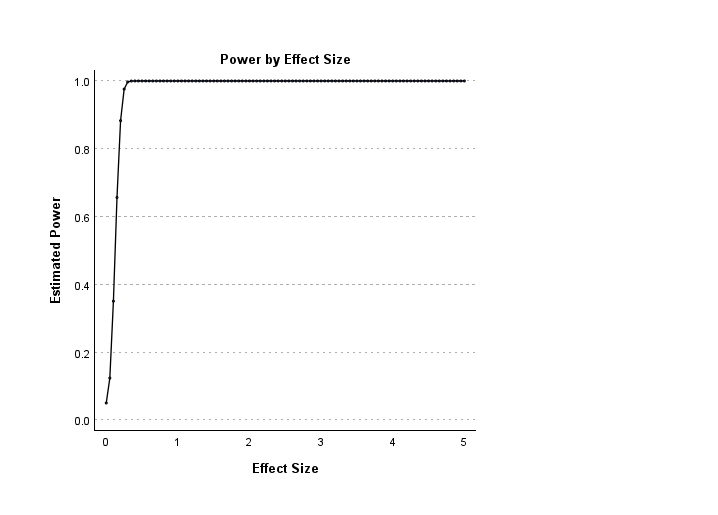
Tick Power estimation versus effect size to see how power changes with different effect sizes.
6. Step: Run the Power Analysis: Once all fields are complete and the plot options are set, click OK to run the analysis.
Note:
Conducting a Power analysis in SPSS offers a solid foundation for planning and understanding the statistical requirements of your study. Always check the official documentation for your specific SPSS version, as menu paths and options may vary slightly.
This step-by-step guide is based on SPSS version 30. If your version does not include the built-in power analysis feature, you can also use G*Power, a free and widely trusted alternative for conducting power analyses.
6. SPSS Output for the Power Analysis of a One-Sample t-Test
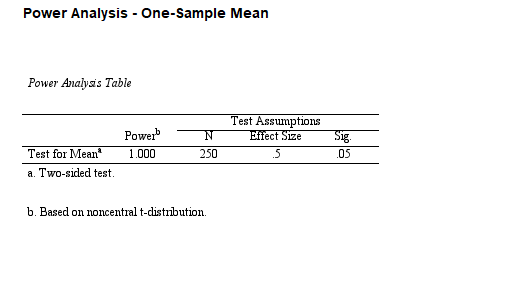
7. How to Interpret the Power Analysis of a One-Sample t-Test
Proper interpretation ensures transparent reporting. Use this checklist when analyzing the output:
Verify Input Accuracy: Confirm that the mean difference, standard deviation, and alpha match your study context.
Check Achieved Power: If power < 0.80, increase the sample size or reconsider the effect size.
Document in the Methods Section: Describe the parameters used to justify the sample size calculation.
Cite in the Results Section: Report the achieved power if performing a post hoc power check.
Commonly Reported Elements for Academic Work:
Hypothesized and expected means
Effect size (Cohen’s d)
Alpha level
Target or achieved power
Final sample size used or required
8. How to Report the Results of a Power Analysis for a One-Sample t-Test in APA Style
In academic writing, clarity and transparency are key. Follow APA guidelines by:
Reporting the type of test and directional hypothesis.
Providing the effect size, alpha level, and power.
Stating the resulting sample size and rationale.
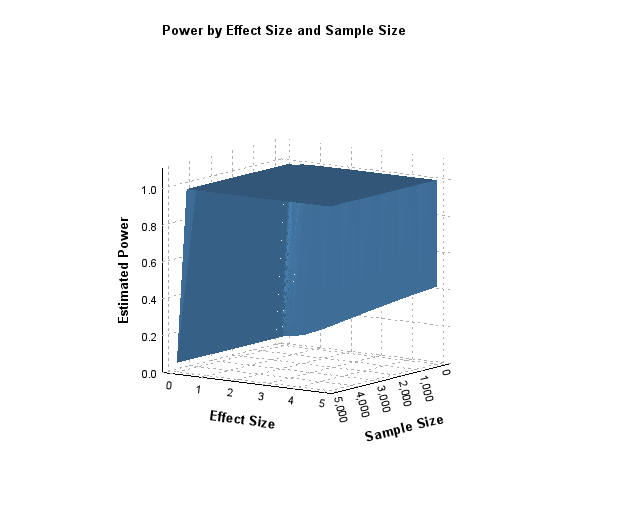
Conducting a power analysis for a one-sample t-test in SPSS is a vital step to ensure your study is properly designed. Following this guide will help you calculate, interpret, and report your power analysis accurately, strengthening the credibility of your research findings.
Get Help For Your SPSS Analysis
Embark on a seamless research journey with SPSSAnalysis.com, where our dedicated team provides expert data analysis assistance for students, academicians, and individuals. We ensure your research is elevated with precision. Explore our pages;
- SPSS Help by Subjects Area: Psychology, Sociology, Nursing, Education, Medical, Healthcare, Epidemiology, Marketing
- Meta Analysis in Psychology
- Meta Analysis in Clinical Research
- Results Writing for Dissertation Students
- Methodology Writing for Dissertation Students
- Statistics Help for Dissertation Students
- Data Analysis Services for Dissertation Students
- Data Analysis Services
- STATA Help for Dissertation Students
- NVivo Free Trial
- Help With SPSS Data Analysis
- Bayesian Statistician
- Hypothesis Testing Help
- Market Research Statistician
- Nursing Capstone Project
- Statistics Help for Capstone Project
- Grant Writing and Statistics
- SPSS Data Analysis for Capstone Project
- Data Analysis Help for Capstone Project
Connect with us at SPSSAnalysis.com to empower your research endeavors and achieve impactful data analysis results. Get a FREE Quote Today!