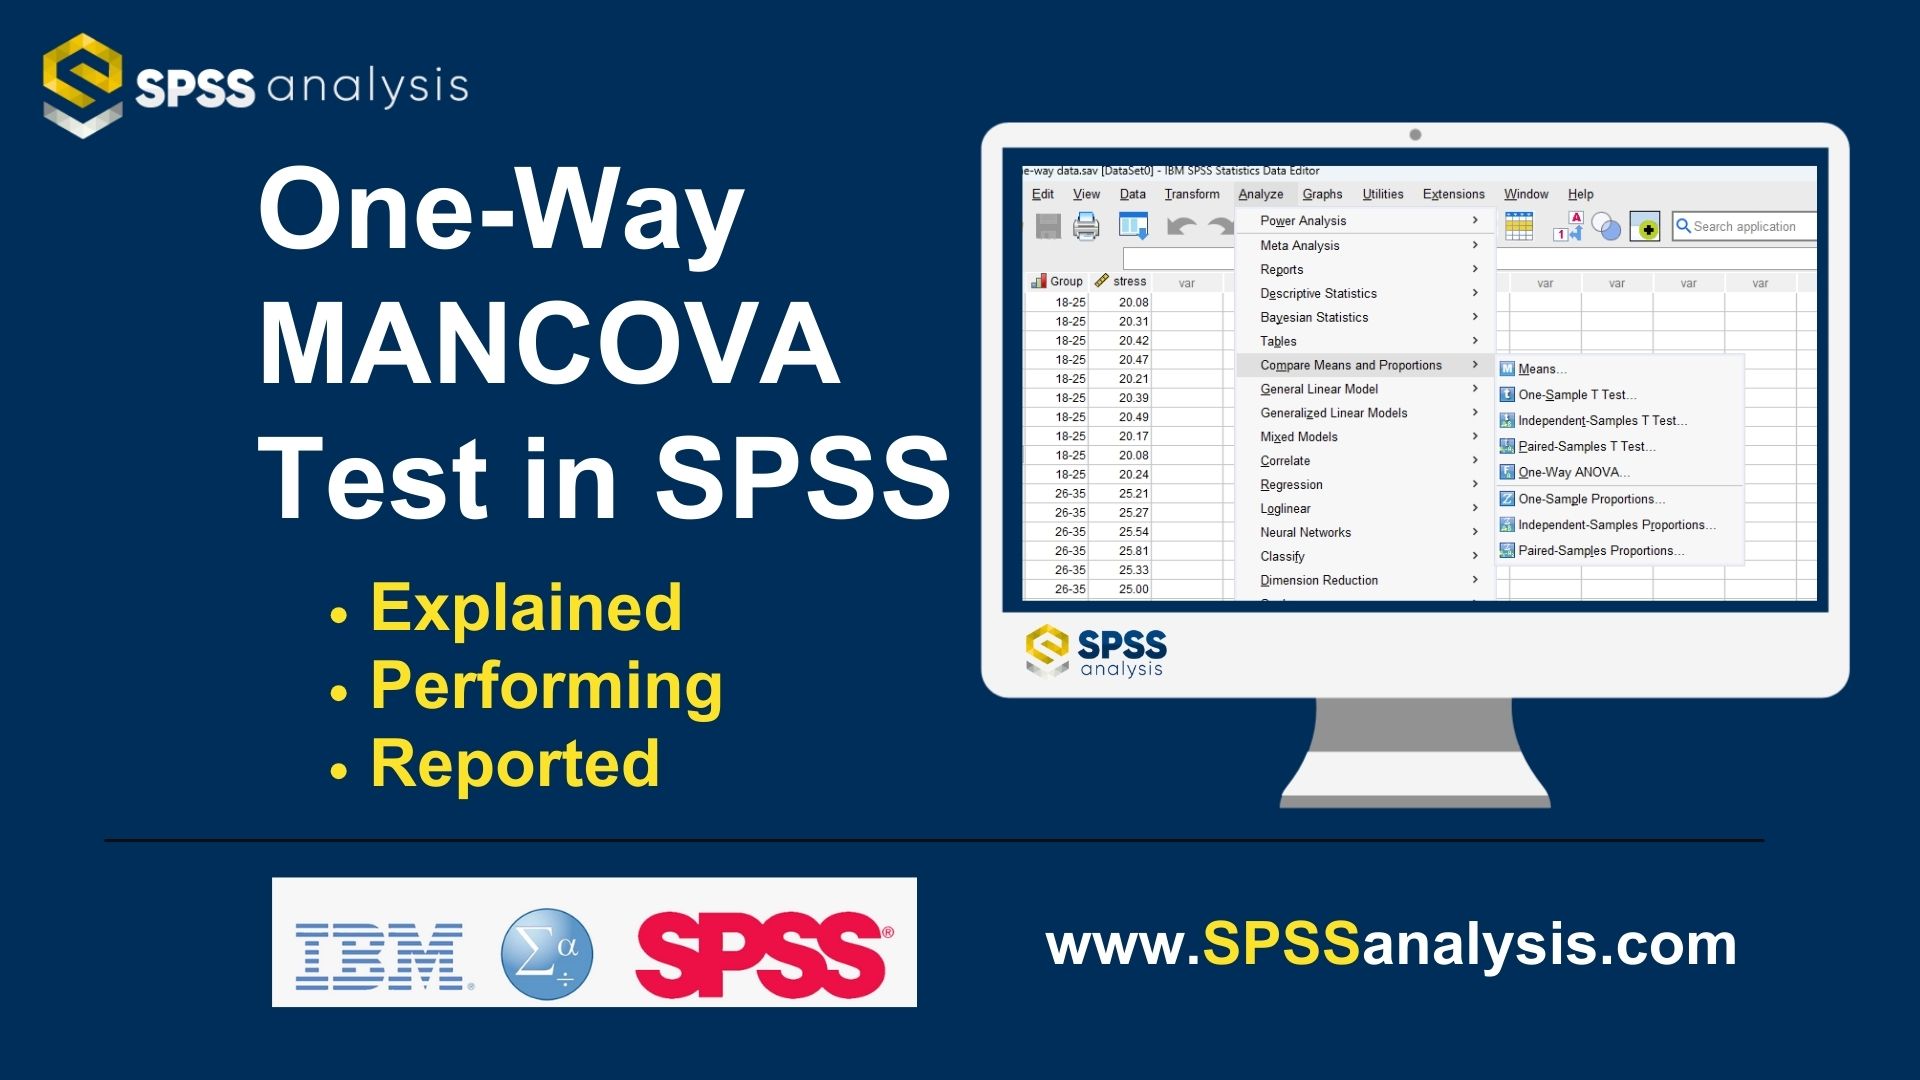
One-Way MANCOVA in SPSS
Discover One-Way MANCOVA in SPSS! Learn how to perform, understand SPSS output, and report results in APA style. Check out this simple, easy-to-follow guide below for a quick read!
Struggling with the Multivariate Analysis of Covariance in SPSS? We’re here to help. We offer comprehensive assistance to students, covering assignments, dissertations, research, and more. Request Quote Now!
Introduction
Embarking on the journey of statistical analysis, this blog post explores the intricacies of One-Way MANCOVA in SPSS, a powerful extension of traditional ANCOVA that delves into multivariate relationships. In the dynamic landscape of research, where the exploration of multiple dependent variables is crucial, One-Way MANCOVA stands as a robust method to analyse the impact of an independent variable on a set of dependent variables while considering covariates. As we navigate through this post, we will unravel the definition, assumptions, and hypotheses of One-Way MANCOVA, providing researchers with a comprehensive understanding of its application. Whether you’re a seasoned statistician or venturing into multivariate analyses for the first time, this post serves as your guide to mastering the complexities of One-Way MANCOVA, ensuring your statistical insights are both accurate and impactful.
Definition
One-Way MANCOVA, or One-Way Multivariate Analysis of Covariance, represents a sophisticated statistical technique employed to examine the impact of a single independent variable on multiple dependent variables while accounting for the influence of one or more covariates. This method builds upon the principles of ANCOVA, introducing a multivariate dimension that allows researchers to assess the relationships between the independent variable, dependent variables, and covariates simultaneously. One-way MANCOVA is particularly valuable when researchers aim to ascertain whether there are significant differences in the combined set of dependent variables across different levels of an independent variable, while controlling for the impact of covariates.
In the subsequent sections, we will explore the assumptions critical for the application of One-Way MANCOVA, formulate hypotheses, provide a practical example, and guide you through the step-by-step process of performing and interpreting the analysis in SPSS.
Assumption of One-Way MANCOVA Test
Ensuring the validity of One-Way MANCOVA results requires a careful consideration of several assumptions. These assumptions set the foundation for the reliability of the analysis and the accurate interpretation of multivariate relationships. Here are the key assumptions:
- Multivariate Normality: The dependent variables should follow a multivariate normal distribution within each group. Multivariate normality ensures that the statistical inferences drawn from the analysis are robust and accurate.
- Homogeneity of Covariance Matrices: The covariance matrices of the dependent variables should be approximately equal across all groups. The homogeneity of covariance matrices ensures that the relationships between variables are consistent, allowing for meaningful comparisons.
- Homogeneity of Regression Slopes: The relationships between the independent variable and each dependent variable, as well as the covariates, should be consistent across all groups. This assumption ensures the reliability of regression slopes across groups.
- Absence of Outliers: The dataset should be free from outliers that could disproportionately influence the results. Outliers can distort the estimation of parameters and compromise the integrity of the analysis.
- Linearity: The relationships between the independent variable, dependent variables, and covariates should be linear. This assumption ensures that the impact of the independent variable is consistent across the range of values.
The hypothesis of One-Way MANCOVA Test
Formulating clear and precise hypotheses is integral to the success of One-Way MANCOVA. The hypotheses guide researchers in examining the impact of the independent variable on multiple dependent variables while considering covariates. The hypotheses are as follows:
Main Effects
- Null Hypothesis: There are no significant differences in the combined set of dependent variables across the levels of the independent variable, after adjusting for the covariates.
- Alternative Hypothesis: There are significant differences in the combined set of dependent variables across the levels of the independent variable, after adjusting for the covariates.
Covariate Effect
- Null Hypothesis: The impact of the covariate(s) on the combined set of dependent variables is not significant.
- Alternative Hypothesis: The impact of the covariate(s) on the combined set of dependent variables is significant.
These hypotheses guide researchers in exploring the relationships and differences among variables in a multivariate context. Now, let’s delve into a practical example to illustrate the application of One-Way MANCOVA in a research scenario.
Example of One-Way MANCOVA
Consider a study investigating the impact of different teaching methods (independent variable) on various subjects (Maths, Chemistry – dependent variables) while considering the influence of a pre-existing academic aptitude score as a covariate. Additionally, researchers consider the amount of time spent on homework each week (a continuous covariate). The hypotheses for this study would be as follows:
Main Effects
- Null Hypothesis: There is no significant difference in the adjusted means of the maths scores across the teaching methods, after accounting for the covariate (homework time).
- Alternative Hypothesis: There is a significant difference in the adjusted means of the maths scores across the teaching methods, after accounting for the covariate.
Second Main Effects
- Null Hypothesis: There is no significant difference in the adjusted means of the chemistry scores across the teaching methods, after accounting for the covariate (homework time).
- Alternative Hypothesis: There is a significant difference in the adjusted means of the chemistry scores across the teaching methods, after accounting for the covariate.
Covariate Effect
- Null Hypothesis: The effect of homework time on the final exam scores is not significant.
- Alternative Hypothesis: The effect of homework time on the final exam scores is significant.


Step by Step: Running One Way MANCOVA Test in SPSS Statistics
Now, let’s delve into the step-by-step process of conducting the One-Way MANCOVA Test using SPSS. Here’s a step-by-step guide on how to perform a Multivariate Analysis of Variance (MANCOVA) in SPSS:
- STEP: Load Data into SPSS
Commence by launching SPSS and loading your dataset, which should encompass the variables of interest – a categorical independent variable. If your data is not already in SPSS format, you can import it by navigating to File > Open > Data and selecting your data file.
- STEP: Access the Analyze Menu
In the top menu, locate and click on “Analyze.” Within the “Analyze” menu, navigate to “General Linear Model” and choose ” Multivariate” Analyze > General Linear Model> Multivariate
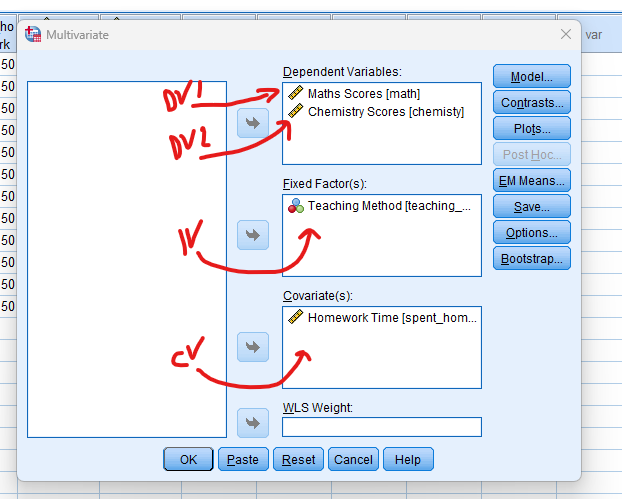
- STEP: Specify Variables
In the dialogue box, move the dependent variables to the “Dependent Variable” field. Move the variable representing the group or factor to the “Fixed Factor (s)” field. This is the independent variable with different levels or groups. the covariate to the “Covariate(s)” box.
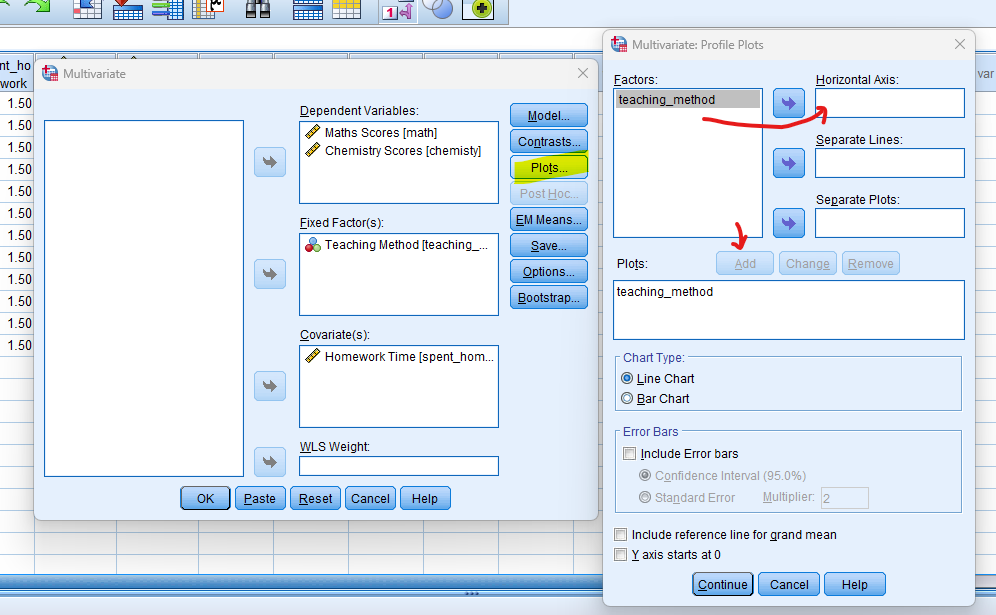
- STEP: Post-Hoc and Plots
Click on the “Plot” button, Move to Factor into the Horizontal Axis, and then click the “Add” button.
- STEP: Options
Snap on the “Options” button Check “Descriptive”, “Homogeneity Test” and “Estimates of effect size”
- STEP: Generate SPSS Output
Once you have specified your variables and chosen options, click the “OK” button to perform the analysis. SPSS will generate a comprehensive output, including the requested frequency table and chart for your dataset.
Executing these steps in SPSS initiates the One-Way MANCOVA analysis, allowing for the assessment of group differences in the combined set of dependent variables while considering the impact of covariates. Now, let’s move on to interpreting the output of One-Way MANCOVA in SPSS.
Note
Conducting a One-Way MANCOVA test in SPSS provides a robust foundation for understanding the key features of your data. Always ensure that you consult the documentation corresponding to your SPSS version, as steps might slightly differ based on the software version in use. This guide is tailored for SPSS version 25, and for any variations, it’s recommended to refer to the software’s documentation for accurate and updated instructions.
SPSS Output for Multivariate Analysis of Variance
How to Interpret SPSS Output of MANCOVA Test
When interpreting the SPSS output of One-Way MANCOVA, focus on key elements that provide insights into the impact of the independent variable on the set of dependent variables:
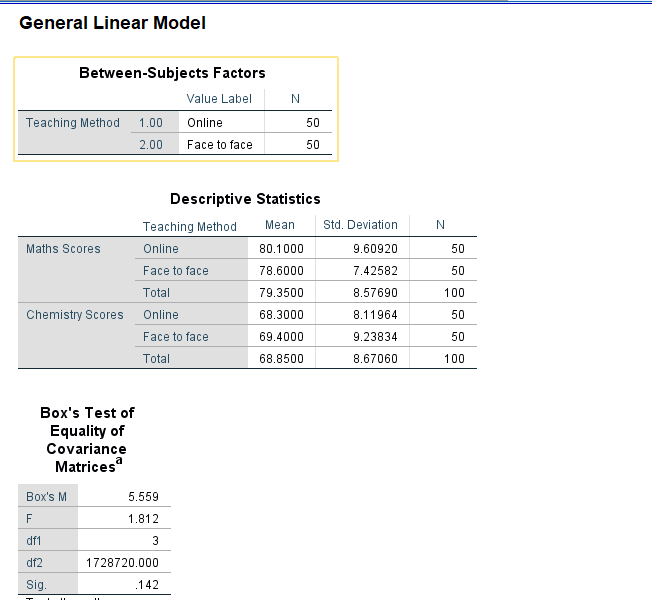
Descriptives Table
- Mean and Standard Deviation: Evaluate the means and standard deviations of each group. This provides an initial overview of the central tendency and variability within each group.
- Sample Size (N): Confirm the number of observations in each group. Discrepancies in sample sizes could impact the interpretation.
Box’s M Test
- Box’s M test for homogeneity of covariance matrices: A significant result may indicate a violation of the assumption of homogeneity of variances.
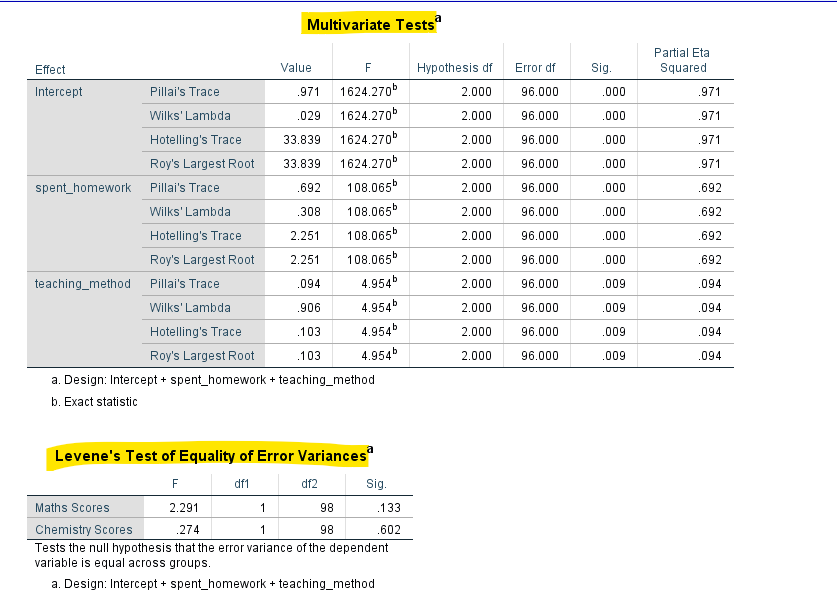
Multivariate Tests Table
Multivariate Tests table for additional statistical information, including Wilks’ Lambda Test, Pillai’s Trace, Hotelling’s Trace, and Roy’s Largest Root. These tests contribute to the overall assessment of the impact of the independent variable.
- Wilks’ Lambda test: A significant result indicates that there are significant differences in the multivariate pattern of the dependent variables across the levels of the independent variable.
Test of Homogeneity of Variances Table
- Levene’s Test: In the Test of Homogeneity of Variances table, look at Levene’s Test statistic and associated p-value. This test assesses whether the variances across groups are roughly equal. A non-significant p-value suggests that the assumption of homogeneity of variances is met.
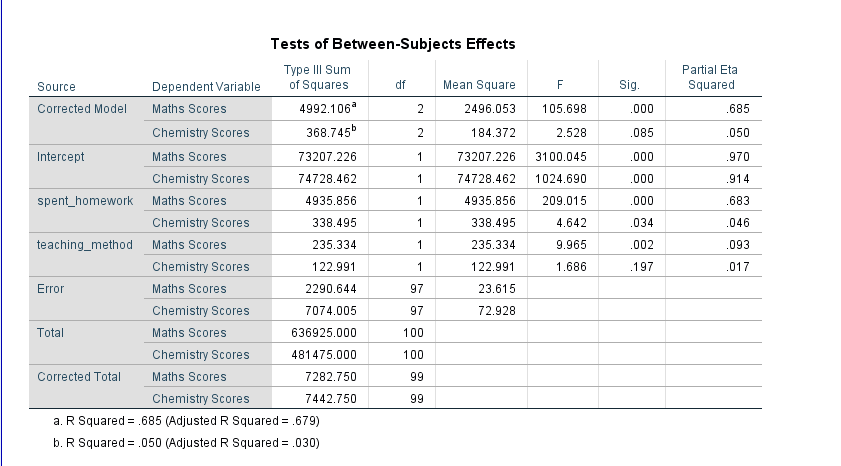
Tests of Between-Subjects Effects
- Between-Groups: Move on to the ANOVA table, which displays the Between-Groups, degrees of freedom, mean squares, the F-ratio, and the p-value.
- F-Ratio: Focus on the F-ratio. A higher F-ratio indicates larger differences among group means relative to within-group variability.
- Degrees of Freedom: Note the degrees of freedom for Between-Groups. These values are essential for calculating the critical F-value.
- P-Value: Examine the p-value associated with the F-ratio. If the p-value is below your chosen significance level (commonly 0.05), it suggests that at least one group mean is significantly different.
- Eta-squared: If available, consider effect size measures in the ANOVA table. Eta-squared indicates the proportion of variance in the dependent variable explained by the group differences.
Post Hoc Tests Table (If Applied):
- Specific Group Differences: If you conducted post-hoc tests, examine the results. Look for significant differences between specific pairs of groups. Pay attention to p-values and confidence intervals to identify which groups are significantly different from each other.
By systematically analyzing these components, you gain a comprehensive understanding of whether there are significant differences in the multivariate pattern of dependent variables across the levels of the independent variable. In the following section, we’ll guide you on how to report the results of One-Way MANCOVA in APA style, ensuring clarity and adherence to academic standards.
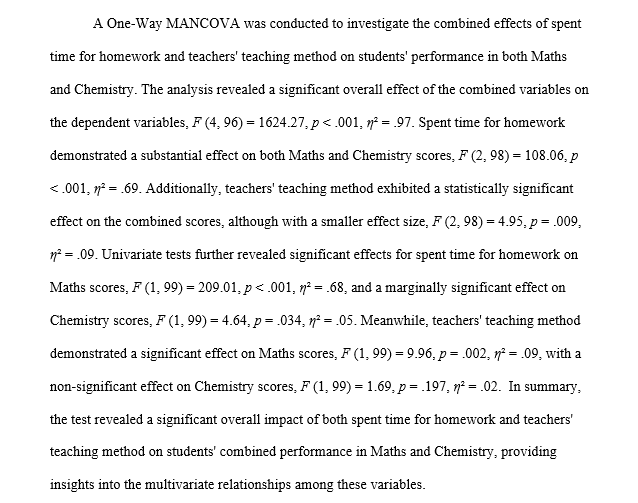
How to Report Results of One-Way MANCOVA Test in APA
Crafting a concise and structured report of your One-Way MANCOVA results in APA style ensures effective communication. Here’s a step-by-step guide:
- Introduction: Begin with a brief introduction, outlining the purpose of the analysis and specifying the independent variable and dependent variables under investigation.
- Analysis Conducted: Clearly state that a One-Way MANCOVA was conducted to examine the impact of [Independent Variable] on the multivariate pattern of [Dependent Variables].
- Results Summary: Present a summary of the results, including the significance level of the Wilks’ Lambda test. For example, “The analysis revealed a significant effect of [Independent Variable] on the multivariate pattern of [Dependent Variables] (Wilks’ Lambda = [value], F(df1, df2) = [F-ratio], p = [p-value]).”
- Post-Hoc Tests (If Applied): If post-hoc tests were conducted, report significant differences between specific groups. For instance, “Post-hoc tests using [Post-Hoc Test] indicated a significant difference between [specific groups] (p < 0.05).”
- Effect Size Measures (Optional): If relevant, report effect size measures (e.g., partial eta-squared) to provide insights into the practical significance of the findings.
Conclude by discussing the implications of your results and their broader relevance. Address any limitations of the study and suggest avenues for future research. This structured approach ensures that your report is informative and aligns with the conventions of APA style, providing a clear and concise summary of your One-Way MANCOVA analysis.
Get Help For Your SPSS Analysis
Embark on a seamless research journey with SPSSAnalysis.com, where our dedicated team provides expert data analysis assistance for students, academicians, and individuals. We ensure your research is elevated with precision. Explore our pages;
- SPSS Data Analysis Help – SPSS Helper,
- Quantitative Analysis Help,
- Qualitative Analysis Help,
- SPSS Dissertation Analysis Help,
- Dissertation Statistics Help,
- Statistical Analysis Help,
- Medical Data Analysis Help.
Connect with us at SPSSAnalysis.com to empower your research endeavors and achieve impactful results. Get a Free Quote Today!