Missing at Random in SPSS
Discover Missing at Random in SPSS! Learn how to perform, understand SPSS output, and report results in APA style. Check out this simple, easy-to-follow guide below for a quick read!
Struggling with MAR in SPSS? We’re here to help. We provide comprehensive support to academics and PhD students, encompassing assignments, dissertations, research, and additional services. Request Quote Now!
1. Introduction
Handling missing data is one of the most important and nuanced steps in statistical analysis. The assumption about why data are missing affects which methods are valid for handling them. Among the commonly discussed mechanisms of missingness, Missing at Random (MAR) is the most frequently assumed in modern statistical modeling. It allows for principled handling of missing data using advanced techniques like multiple imputation. This guide explains what MAR means, how it relates to other missing data types, how it’s addressed in SPSS, and why it matters for your analysis.
2. What is MAR?
Missing at Random (MAR) refers to a condition in which the probability that a value is missing depends on observed data but not on the missing value itself. In other words, once we account for certain known variables, the missingness does not carry any additional systematic pattern. For example, suppose income is more likely to be missing for older participants. If age is recorded for all participants, then the missingness in income can be considered MAR, because it is explainable based on another variable that is fully observed.
This is a weaker assumption than MCAR (Missing Completely at Random), and it is also more realistic in many real-world datasets. MAR is the foundation for most modern multiple imputation procedures.
3. What Are the Differences Among MCAR, MAR, and MNAR?
Understanding the differences between missing data mechanisms is crucial for choosing the right analysis method:
MCAR (Missing Completely at Random): Missingness is unrelated to any variable. Safe to ignore or delete missing cases.
MAR (Missing at Random): Missingness is related to observed variables but not to the missing values themselves. Requires imputation methods like MICE.
MNAR (Missing Not at Random): Missingness depends on the unobserved value itself (e.g., people with higher incomes are more likely not to report it). Requires modeling the missingness process or sensitivity analysis.
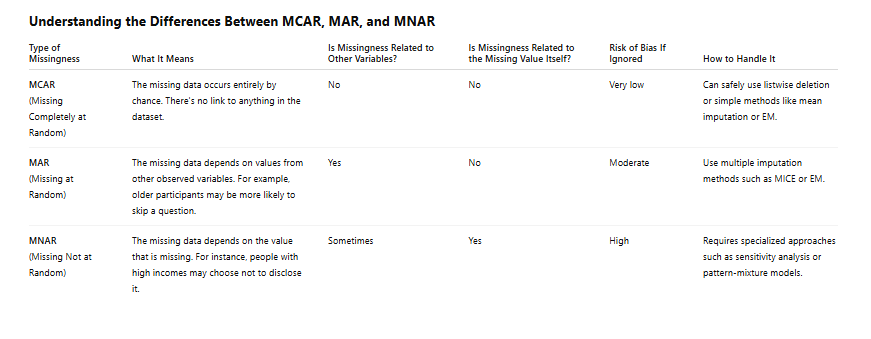
Only MCAR allows unbiased listwise deletion. Both MAR and MNAR require more thoughtful imputation or modeling strategies.
4. How Are MAR and MICE Related?
The MAR assumption is central to the validity of modern imputation methods, especially Multiple Imputation by Chained Equations (MICE). MICE operates under the premise that missingness can be predicted using other observed variables in the dataset. It builds separate models for each variable with missing values, using the other variables as predictors, and iteratively imputes values over multiple cycles.
If the data are MAR, MICE can produce unbiased parameter estimates and valid standard errors. Thus, before applying MICE, analysts must assess whether MAR is a reasonable assumption based on the observed relationships between missingness and available data. MICE is not a method to test for MAR, but rather a technique that is appropriate only if MAR can be assumed.
5. How to Test Missing at Random in SPSS?
Although MAR cannot be tested directly (since it involves unobserved data), its plausibility can be assessed by checking whether missingness in one variable is systematically related to observed values in other variables. In SPSS, this can be done by:
Creating missingness indicators (e.g., 0 = observed, 1 = missing)
Using independent samples t-tests or chi-square tests to compare observed values between groups with and without missing data
Exploring output from the Missing Value Analysis procedure in SPSS, particularly the Separate Variance t-tests under Univariate Analysis
If a variable’s missingness is related to another fully observed variable, this supports the MAR assumption.
6. Why MAR Is Important for Data Imputation?
Most advanced imputation methods, including MICE, Expectation-Maximization (EM), and Full Information Maximum Likelihood (FIML), rely on the MAR assumption. If MAR holds:
Data imputation using observed variables can reduce bias
Parameter estimates will be more accurate than with listwise deletion
Multiple imputation methods can produce valid standard errors and confidence intervals
In contrast, if the data are MNAR, using MAR-based techniques can result in misleading estimates.
7. What Does a Significant Difference Between Observed and Missing Groups Mean?
In SPSS, the Separate Variance t-tests compare the means of other variables (e.g., Age) between cases with observed and missing values on a target variable (e.g., Income). A significant difference indicates that the missingness in the target variable is related to another observed variable.
For example, if people who did not report their income are significantly older than those who did, this suggests that missingness in income depends on age—a known variable. This supports the MAR assumption, since missingness can be explained by observed data. On the other hand, if there’s no significant difference, the data may be MCAR, and if missingness is suspected to depend on the unobserved income values themselves, MNAR could be present.
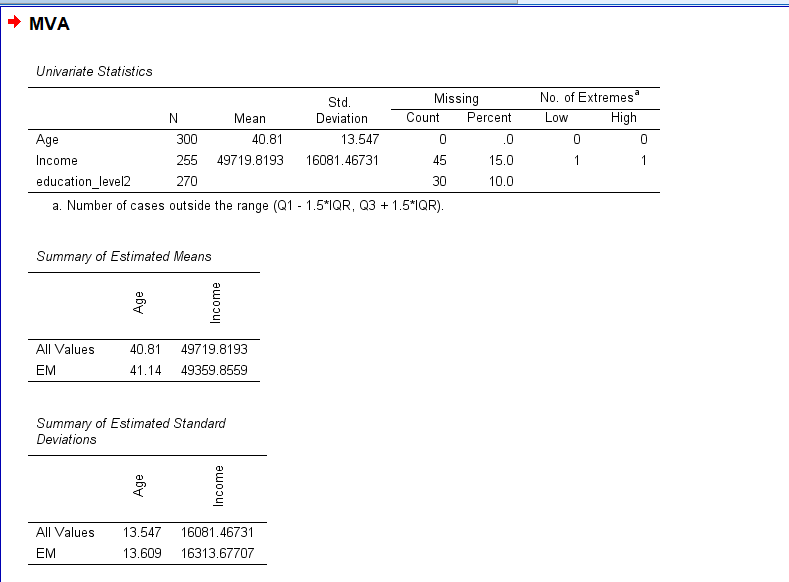
8. An Example for MAR in SPSS
Using a dataset with 300 cases and missing values in Income and Education Level, exploratory analysis showed that participants with missing income data were significantly older than those with observed income data. This pattern suggests that the missingness in income is related to Age (a fully observed variable), supporting the MAR assumption and justifying the use of multiple imputation techniques.


Step by Step: Running Missing at Random (MAR) in SPSS Statistics
Let’s embark on a step-by-step guide on performing the MAR using SPSS
1. Step: Go to Analyze → Missing Value Analysis.
2. Step: Add variables such as Age, Income, and Education Level to the analysis.
3. Step: Under the Descriptives tab, check Univariate Statistics to include Separate Variance t-tests.
4. Step: Click OK to run the analysis. SPSS will generate output comparing means of observed and missing groups for each variable and their predictors.
This helps identify whether missingness is systematically related to other observed variables—a key indicator for MAR.
Note: Conducting MAR in SPSS provides a robust foundation for understanding the key features of your data. Always ensure that you consult the documentation corresponding to your SPSS version, as steps might slightly differ based on the software version in use.
This guide is tailored for SPSS version 25, and for any variations, it’s recommended to refer to the software’s documentation for accurate and updated instructions.
Alternative Method: Testing MAR in SPSS Using Custom Missingness Indicators
If you prefer a more manual approach to evaluate whether the data may be Missing at Random (MAR), follow these steps to create missingness indicator variables and compare observed vs. missing groups using inferential statistics:
Step 1: Create Missingness Indicators
In SPSS:
Go to Transform → Compute Variable.
Create a new variable to indicate missingness. For example:
income_miss_ind:
income_miss_ind = MISSING(Income)
(This creates a binary variable: 1 = missing, 0 = observed)Repeat this for other variables as needed.
Step 2: Run Independent Samples t-Tests
Compare the means of observed predictors (e.g., Age, Education Level) across the groups defined by the missingness indicator.
Go to Analyze → Compare Means → Independent-Samples T Test.
Move a fully observed variable (e.g., Age) into the “Test Variable” box.
Move your missingness indicator (e.g., income_miss_ind) into the “Grouping Variable” box.
Define groups as:
Group 1: 0 (observed)
Group 2: 1 (missing)
This tests whether the predictor (e.g., Age) differs significantly between cases with and without missing Income values.
Step 3: Run Chi-Square Tests for Categorical Variables
If your predictor is categorical (e.g., Education Level), run a chi-square test instead:
Go to Analyze → Descriptive Statistics → Crosstabs.
Place the missingness indicator in the Rows and your categorical predictor in the Columns.
Click Statistics and select Chi-square.
This evaluates whether missingness in one variable is associated with categories of another variable.
Step 4: Interpret the Results
Significant test results (e.g., p < .05) suggest that missingness is related to observed variables → this supports the MAR assumption.
Non-significant results suggest missingness may be MCAR.
If you suspect missingness depends on the unobserved value itself, it may be MNAR, but this cannot be formally tested in SPSS.
10. SPSS Output for Missing at Random

11. How to Interpret SPSS Output of Missing Value Analysis
The SPSS output includes several components relevant for assessing MAR:
Univariate Statistics: Provides means and standard deviations for valid cases, along with missing data counts.
Separate Variance t-tests: Compares means between observed and missing groups across variables. Significant differences here indicate associations between missingness and observed data.
EM Means and Covariances (if EM is requested): Provide additional summary statistics post-imputation.
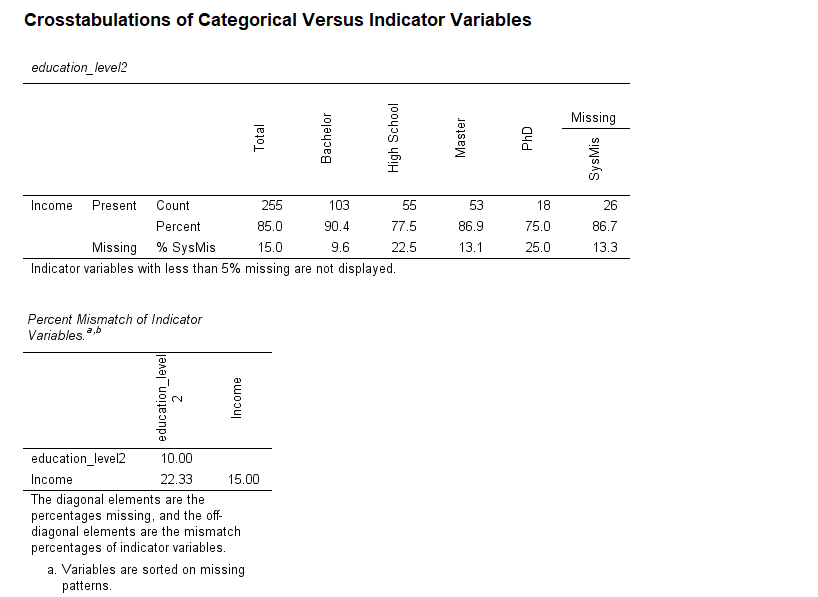
Missing Data Patterns Table: Shows combinations of missing variables across cases, useful for detecting arbitrary vs. monotone missingness.
These outputs, while not definitive proof, help you evaluate whether the assumption of MAR is supported.
A comprehensive understanding of SPSS output is essential for drawing accurate conclusions from your Nonlinear Regression results. In the subsequent section, we will guide you on how to effectively report these findings following the guidelines of the American Psychological Association (APA).
12. How to Report Results of Missing at Random (MAR) in APA
To interpret whether MAR is a reasonable assumption, examine the Separate Variance t-tests:
If a variable (e.g., Age) differs significantly between cases with missing vs. non-missing values for another variable (e.g., Income), then missingness is related to an observed variable. This suggests the data may be MAR.
If there are no significant associations, missingness may be MCAR.
If you suspect missingness depends on the value itself (e.g., high earners hiding income), then MNAR is possible.
If the SPSS output shows that missingness can be explained by variables that are fully observed, multiple imputation techniques like MICE are appropriate and likely to yield valid results.

Get Help For Your SPSS Analysis
Embark on a seamless research journey with SPSSAnalysis.com, where our dedicated team provides expert data analysis assistance for students, academicians, and individuals. We ensure your research is elevated with precision. Explore our pages;
- SPSS Help by Subjects Area: Psychology, Sociology, Nursing, Education, Medical, Healthcare, Epidemiology, Marketing
- Dissertation Methodology Help
- Dissertation Data Analysis Help
- Dissertation Results Help
- Pay Someone to Do My Data Analysis
- Hire a Statistician for Dissertation
- Statistics Help for DNP Dissertation
- Pay Someone to Do My Dissertation Statistics
Connect with us at SPSSAnalysis.com to empower your research endeavors and achieve impactful data analysis results. Get a FREE Quote Today!