Missing Analyse Patterns in SPSS
Learn how to run Missing Analyse Patterns in SPSS. This guide explains the process, output, and interpretation to support informed data imputation strategies. Check out this simple, easy-to-follow guide below for a quick read!
Struggling with Missing Data Analysis in SPSS? We’re here to help. We offer comprehensive assistance to students, covering assignments, dissertations, research, and more. Request Quote Now!
1. Introduction
Missing data is a persistent issue in research and applied data analysis, often threatening the validity and interpretability of statistical models. Before addressing missing values through deletion or imputation, it is essential to understand the structure and distribution of those missing values. SPSS offers dedicated tools to assess the pattern of missingness, providing valuable insights into whether the missing data is systematic or random. In this article, we focus on the Missing Analyse Patterns in SPSS, a core diagnostic step for any robust missing data strategy.
2. What is Missing Analyse Patterns?
Missing Analyse Patterns in SPSS refers to the diagnostic procedure that identifies and tabulates patterns of missing values across multiple variables. Instead of simply reporting the amount of missing data per variable, this analysis clusters cases with identical missingness patterns, helping the researcher see whether missing values tend to co-occur in specific ways. These patterns can be monotonic (e.g., variables further down a survey are more likely to be missing) or arbitrary (no clear structure), and they have direct implications for how missing data should be handled.
3. What is Data Imputation?
Data imputation is the statistical process of estimating and replacing missing values in a dataset. The goal is to preserve the structure and validity of the data while minimizing bias introduced by missingness. Imputation techniques range from simple substitutions, like replacing with the mean, to complex approaches such as multiple imputation or model-based methods. The effectiveness of imputation strongly depends on the assumptions about why data are missing, which is precisely why understanding missing patterns is a prerequisite to any imputation strategy.
4. Why is Missing Analyse Patterns Important for Data Imputation?
Understanding missing data patterns plays a critical role in determining how to handle incomplete data. Here’s why:
Identifies the structure of missingness: Determines whether the missing data follow a monotone or arbitrary pattern, which directly impacts the imputation strategy.
Guides the choice of imputation method: Monotone patterns can be handled using simpler sequential methods, while arbitrary patterns require flexible techniques like Fully Conditional Specification (FCS).
Supports assumptions testing: Helps assess whether data are Missing Completely at Random (MCAR), Missing at Random (MAR), or Missing Not at Random (MNAR).
Reveals variable-level dependencies: Shows whether certain variables tend to be missing together, indicating potential bias or systematic missingness.
Improves efficiency of data repair: Knowing the pattern reduces unnecessary data loss by enabling targeted imputation rather than blanket listwise deletion.
5. An Example for Missing Analyse Patterns in SPSS
Imagine a dataset including demographic and socioeconomic variables such as Age, Income, and Education Level. Upon inspection, you notice that missing values are not isolated to one variable but tend to cluster—for instance, if Income is missing, Education is also frequently missing. Using the Missing Analyse Patterns procedure in SPSS, you can detect these joint patterns, quantify how many cases follow each pattern, and make informed decisions about how to impute or model the data.

Step by Step: Running Missing Analyse Patterns in SPSS Statistics
Let’s embark on a step-by-step guide on performing the Missing Analyse Patterns using SPSS
1. Step: Load your dataset into SPSS and ensure missing values are properly coded (e.g., system-missing or defined user-missing values).
2. Step : Go to the top menu and click:Analyze → Multiple Imputation → Analyze Patterns
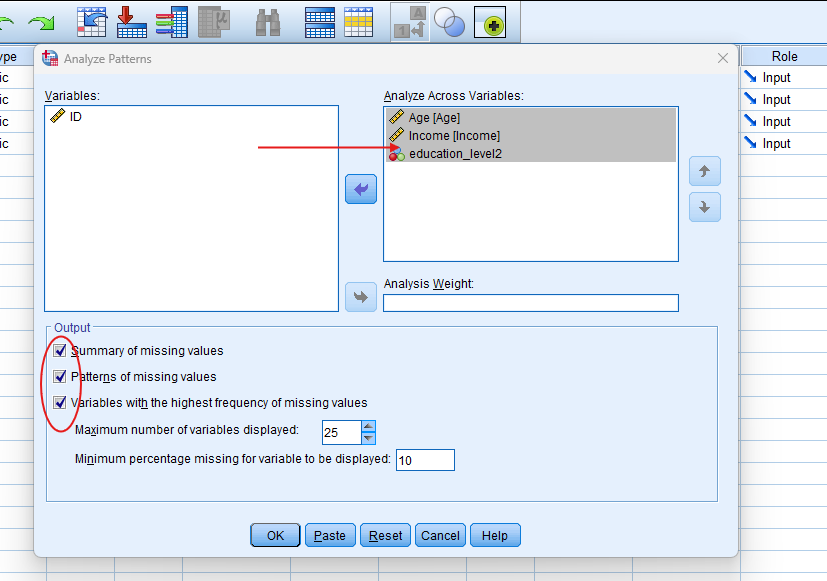
3. Step: In the dialog box, move the variables you want to assess into the “Variables” box. These can include continuous, ordinal, or nominal variables.
4. Step: (Optional) You can tick the box to display summary statistics or request frequency tables for missing values, depending on your diagnostic goal.
Step 5: Click OK to run the analysis.
SPSS will generate a summary table showing the number of unique missing data patterns, the variables involved in each pattern, and the frequency with which each pattern occurs. This tool is especially useful as a precursor to multiple imputation or before deciding on listwise or pairwise deletion strategies.
Note: Conducting Analyse Patterns in SPSS provides a robust foundation for understanding the key features of your data. Always ensure that you consult the documentation corresponding to your SPSS version, as steps might slightly differ based on the software version in use.
This guide is tailored for SPSS version 25, and for any variations, it’s recommended to refer to the software’s documentation for accurate and updated instructions.
7. SPSS Output for Missing Analyse Patterns

8. How to Interpret SPSS Output of Analyse Patterns
SPSS will generate output, including the Overall Summary of Missing Values, Missing Analyse Pattern Plots.
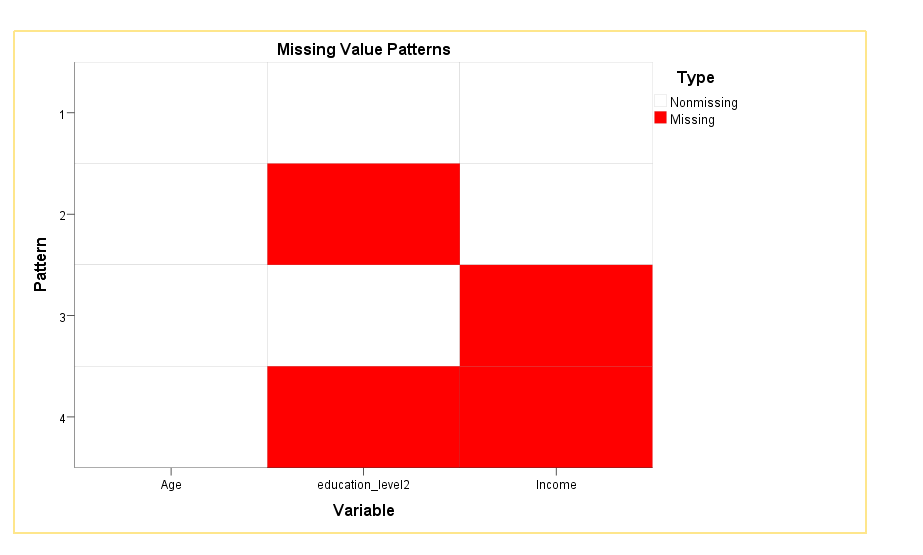
The first key output is a Missing Value Patterns heatmap (Figure 1), where each row represents a unique pattern of missing data, and each column corresponds to a variable. Red cells indicate missing values, while white cells represent observed data. In your example, Pattern 1 shows no missing values across Age, Education Level, or Income, while Patterns 2 through 4 reflect different combinations of missingness — such as missing Education Level only, or both Education Level and Income.
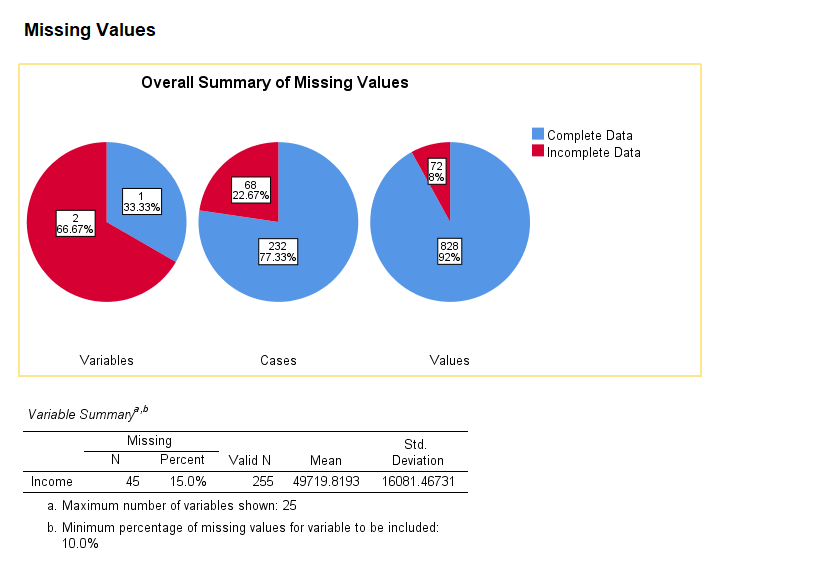
SPSS also provides a bar chart (Figure 2) summarizing the percentage of cases within each pattern. In this case, over 75% of cases fall under Pattern 1 (complete cases), while the remaining patterns account for varying proportions of incomplete cases. This helps quantify how much data might be retained or lost under listwise deletion, and where targeted imputation might be most effective.
Finally, the Variable Summary table highlights variables exceeding the specified missingness threshold (in this example, 10%). Here, Income is flagged with 15% missingness, along with summary statistics for valid cases. This table helps prioritize which variables require attention in further data cleaning or imputation procedures.
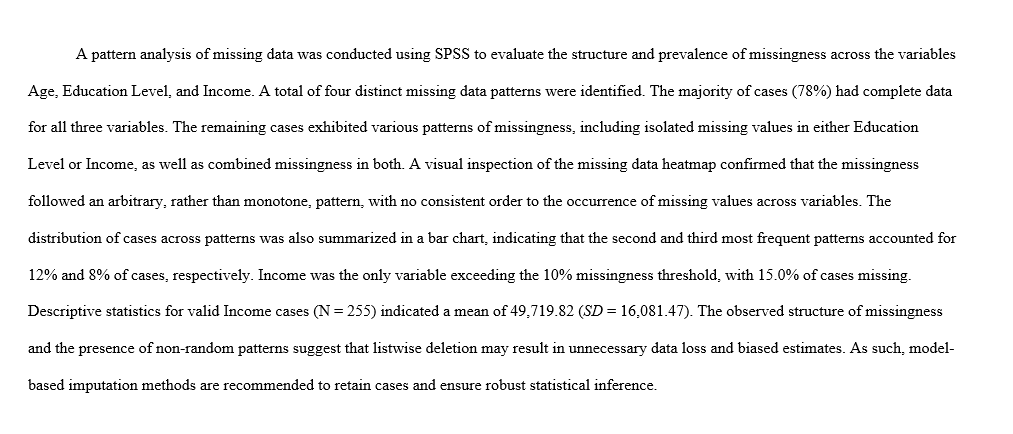
9. How to Report Results of Analyse Patterns in APA
Reporting the results of Missing Analyse Patterns in APA (American Psychological Association) format requires a structured presentation. Here’s a step-by-step guide in list format:
When interpreting the pattern output, focus on these key aspects:
Type of pattern: monotone vs. arbitrary
If missingness cascades in a predictable order, the pattern is monotone, which simplifies imputation. If not, it’s arbitrary, requiring more advanced methods like MICE.Concentration of missingness
Patterns affecting large numbers of cases suggest systemic issues (e.g., dropout or nonresponse in a subgroup), while scattered patterns indicate randomness.Impact on complete-case analysis
The final column (“Complete if…”) shows how many cases would remain if certain variables or patterns were excluded. This allows you to evaluate whether listwise deletion would result in unacceptable data loss.Use for imputation design
The patterns inform how to construct your imputation model: which variables need to be jointly modeled and whether sequential or iterative estimation is required.
By interpreting these elements, you gain a strategic advantage in designing a missing data handling approach that preserves statistical validity and maximizes usable data.
Get Help For Your SPSS Analysis
Embark on a seamless research journey with SPSSAnalysis.com, where our dedicated team provides expert data analysis assistance for students, academicians, and individuals. We ensure your research is elevated with precision. Explore our pages;
- SPSS Help by Subjects Area: Psychology, Sociology, Nursing, Education, Medical, Healthcare, Epidemiology, Marketing
- Dissertation Methodology Help
- Dissertation Data Analysis Help
- Dissertation Results Help
- Pay Someone to Do My Data Analysis
- Hire a Statistician for Dissertation
- Statistics Help for DNP Dissertation
- Pay Someone to Do My Dissertation Statistics
Connect with us at SPSSAnalysis.com to empower your research endeavors and achieve impactful data analysis results. Get a FREE Quote Today!