Mediation Analysis with Hayes PROCESS Macro
Discover Mediation Analysis with Hayes PROCESS! Learn how to perform, understand SPSS output, and report results in APA style. Check out this simple, easy-to-follow guide below for a quick read!
Struggling with Mediation Analysis in SPSS? We’re here to help. We offer comprehensive assistance to students, covering assignments, dissertations, research, and more. Request Quote Now!

Introduction
Mediation analysis plays a crucial role in understanding the mechanisms through which an independent variable influences a dependent variable via a mediator. This analytical technique provides insights into indirect effects, revealing the underlying pathways that drive observed relationships. Researchers in psychology, social sciences, and behavioural studies often rely on mediation analysis to draw more precise conclusions from their data.
Utilising the Hayes PROCESS Macro for SPSS significantly simplifies the mediation analysis process. This powerful tool automates complex calculations, offering robust and reliable results. By mastering the Hayes PROCESS Macro, researchers can efficiently conduct sophisticated mediation analyses, enhancing the quality and interpretability of their findings. This blog post will guide you through the essentials of performing mediation analysis using Hayes PROCESS, from installation to interpretation.
PS: This post explains the Hayes PROCESS Macro method in SPSS for mediation analysis. If you prefer to use traditional regression, please visit our guide on “Mediation Analysis using Regression Method in SPSS.”
What is Mediation Analysis?
Mediation analysis examines how an independent variable (X) affects a dependent variable (Y) through an intermediary variable, known as the mediator (M). Essentially, it tests whether the relationship between X and Y is direct or whether it operates through M. This type of analysis is crucial in behavioural sciences, where understanding the mechanisms behind observed effects can lead to more targeted interventions.

Mediation analysis involves estimating the indirect effect of X on Y through M. This indirect effect is the product of two paths: the effect of X on M and the effect of M on Y, controlling for X. Researchers utilise mediation analysis to uncover these indirect pathways, providing deeper insights into causal mechanisms and enhancing the explanatory power of their models.
What are the Steps in Testing Mediation?
- Establish the Relationship between X and M:
– Verify that the independent variable (X) significantly affects the mediator (M).
- Demonstrate the Relationship between M and Y:
– Ensure that the mediator (M) significantly affects the dependent variable (Y), controlling for the independent variable (X).
- Assess the Direct Effect of X on Y:
– Measure the direct effect of the independent variable (X) on the dependent variable (Y).
- Compare the Direct Effects:
– Compare the direct effect of X on Y before and after including the mediator (M).
– If the direct effect decreases after accounting for M, mediation is indicated.
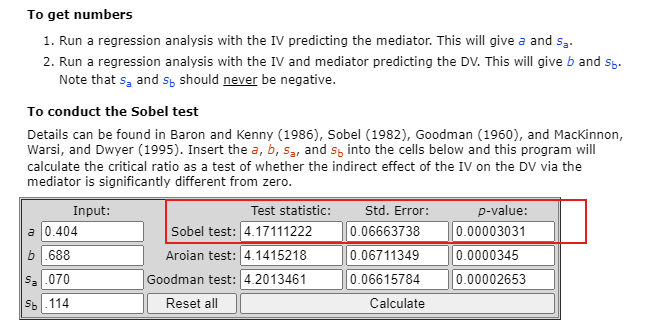
- Conduct Statistical Tests:
– Use statistical tests such as the Sobel test to quantify the significance of the indirect effect.
– Validate the mediation process through these tests.

What is Hayes PROCESS Macro?
Hayes PROCESS Macro is a widely-used statistical tool designed to facilitate mediation, moderation, and conditional process analysis. Developed by Andrew F. Hayes, this macro integrates seamlessly with SPSS, providing an accessible interface for performing complex statistical analyses. The macro’s popularity stems from its ability to automate intricate calculations, reducing the risk of errors and saving valuable time for researchers.
The Hayes PROCESS Macro supports a variety of models, allowing researchers to explore direct, indirect, and conditional effects within their data. By offering bootstrap confidence intervals for indirect effects, the macro ensures more accurate and reliable results. This feature is particularly valuable in mediation analysis, where understanding the significance of indirect effects is crucial. Overall, Hayes PROCESS Macro enhances the analytical capabilities of SPSS, making advanced statistical techniques more accessible.
How to Install Hayes PROCESS Macro in SPSS?
Firstly, download the Hayes PROCESS Macro from the official website. Ensure that you select the correct version compatible with your SPSS software. Once downloaded, locate the file, which typically comes in a .zip format, and extract its contents to a designated folder on your computer.
Next, open SPSS and navigate to the syntax editor by clicking `File > New > Syntax`. In the syntax editor, type the following command: `INSTALL FILE=’C:\path\to\processmacro.sps‘`. Replace `C:\path\to\processmacro.sps` with the actual path to the extracted .sps file. Run the command by highlighting it and pressing the green play button. After installation, the PROCESS Macro will be available under the `Analyze > Regression` menu.
What are the Assumptions of Mediation Analysis?
- Linearity: The relationships between the variables (independent variable, mediator, and dependent variable) must be linear.
- No Measurement Error: The variables involved in the mediation analysis should be measured without error.
- Independence of Errors: The error terms in the regression equations should be independent.
- No Multicollinearity: The independent variable and the mediator should not be highly correlated.
- Normality: The residuals of the regression equations should be normally distributed.
- Causal Relationships: The hypothesised causal direction between variables should be theoretically justified and temporally ordered.
What is the Hypothesis of Mediation Analysis?
In mediation analysis, the primary hypothesis centres on the indirect effect of the independent variable on the dependent variable through the mediator. Specifically, you hypothesise that the independent variable significantly influences the mediator, and the mediator, in turn, significantly influences the dependent variable, thereby creating an indirect path.
- The null hypothesis (H0): There is no mediation effect. (Meaning the indirect effect equals zero.)
- The alternative hypothesis (H1): The indirect effect is non-zero (indicating a significant mediation effect.)
Testing these hypotheses involves examining the paths from the independent variable to the mediator and from the mediator to the dependent variable, ensuring that both are significant.
An Example of Mediation Analysis
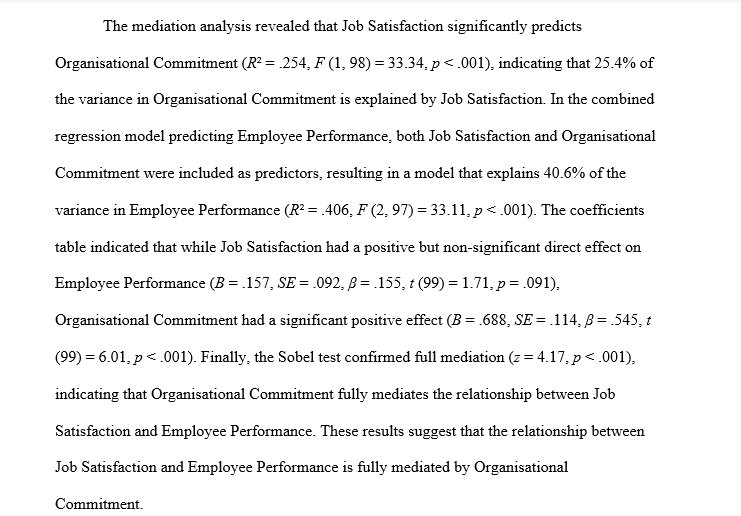
Consider a study examining the impact of job satisfaction (X) on employee performance (Y) through organisational commitment (M). Here, job satisfaction is hypothesised to influence organisational commitment, which in turn affects employee performance. To test this mediation, you would first establish that job satisfaction significantly impacts organisational commitment.
Next, you would demonstrate that organisational commitment significantly affects employee performance, controlling for job satisfaction. Finally, you would compare the direct effect of job satisfaction on employee performance before and after including organisational commitment. If the direct effect diminishes after accounting for organisational commitment, mediation is confirmed, highlighting the mediating role of organisational commitment in this relationship.


Step by Step: Running Mediation Analysis with Hayes PROCESS
Let’s embark on a step-by-step guide on performing the Mediation Analysis using SPSS
1. Prepare Your Dataset:
– Ensure your dataset is loaded in SPSS and includes your independent variable (X), mediator (M), and dependent variable (Y).
2. Open Hayes PROCESS Macro:
– Navigate to `Analyze > Regression > PROCESS vX.X` in SPSS. This will open the Hayes PROCESS Macro dialogue box.
3. Specify Variables:
– In the PROCESS dialogue box, enter your independent variable (X) in the `Independent Variable` field.
– Enter your mediator (M) in the `Mediator Variable` field.
– Enter your dependent variable (Y) in the `Dependent Variable` field.
4. Select Model Type:
– Choose Model 4 from the drop-down menu, as it corresponds to simple mediation analysis.
5. Adjust Bootstrap Samples:
– Set the number of bootstrap samples to 5000. This will provide more accurate confidence intervals for the indirect effect.
6. Configure Output Options:
– Ensure that the options for `Generate Total Effect Model` and `Generate Direct and Indirect Effect Model` are selected. These options will give you comprehensive output, including all relevant effects.
7. Run the Analysis:
– Click the OK button to run the mediation analysis. SPSS will process the data and generate output tables detailing the direct, indirect, and total effects, along with their significance levels.
By following these steps, you can effectively perform mediation analysis using the Hayes PROCESS Macro in SPSS, ensuring accurate and reliable results.
Note: Conducting Mediation Analysis in SPSS provides a robust foundation for understanding the key features of your data. Always ensure that you consult the documentation corresponding to your SPSS version, as steps might slightly differ based on the software version in use. This guide is tailored for SPSS version 25, and for any variations, it’s recommended to refer to the software’s documentation for accurate and updated instructions.
SPSS Output for Mediation Analysis
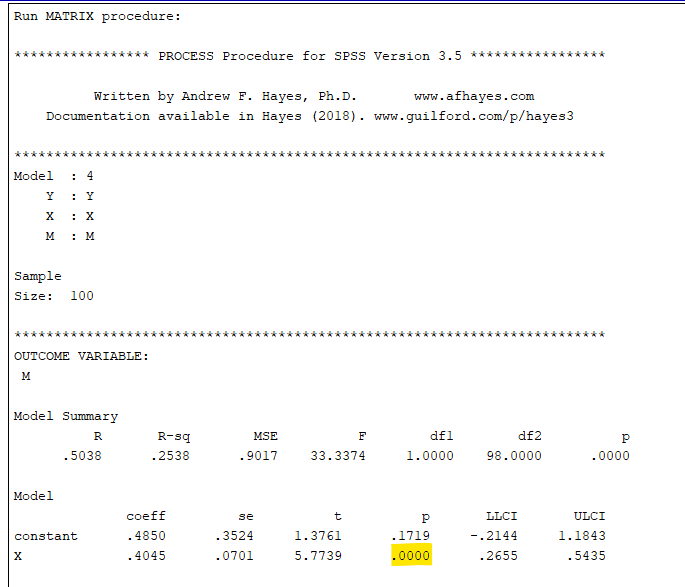

How to Interpret SPSS Output of Mediation Analysis
When interpreting the SPSS output of your mediation analysis, focus on three key tables: Model Summary, ANOVA, and Coefficients.
Model Summary Table:
- R: This represents the correlation between the observed and predicted values of the dependent variable. Higher values indicate a stronger relationship.
- R Square (R²): This value indicates the proportion of variance in the dependent variable explained by the independent and mediator variables. An R² value closer to 1 suggests a better fit.
- Adjusted R Square: Adjusts the R² value for the number of predictors in the model. This value is useful for comparing models with different numbers of predictors.
ANOVA Table:
- F-Statistic: This tests the overall significance of the model. A significant F-value (p < 0.05) indicates that the model significantly predicts the dependent variable.
- (p-value): If the p-value is less than 0.05, the model is considered statistically significant, meaning the independent and mediator variables together significantly predict the dependent variable.
Coefficients Table:
- Unstandardized Coefficients (B): Coefficient of variable
- Constant (Intercept): The expected value of the dependent variable when all predictors are zero.
- Standardized Coefficients (Beta): These coefficients are useful for comparing the relative strength of each predictor in the model.
- t-Statistic and Sig. (p-value): Indicates whether each predictor is significantly contributing to the model. If the p-value is less than 0.05, the predictor is considered statistically significant.
By focusing on these tables, you can effectively interpret the results of your mediation analysis in SPSS, identifying the direct and indirect effects, as well as the overall model significance.
How to Report Results of Mediation Analysis in APA
Reporting the results of mediation analysis in APA (American Psychological Association) format requires a structured presentation. Here’s a step-by-step guide in list format:
- Introduction: Briefly describe the purpose of the mediation analysis and the variables involved.
- Descriptive Statistics: Report the means and standard deviations of the independent variable, mediator, and dependent variable.
- Direct Effect: Provide the regression coefficient, standard error, and p-value for the direct effect of the independent variable on the mediator.
- Indirect Effect: Report the indirect effect of the independent variable on the dependent variable through the mediator, including bootstrap confidence intervals.
- Total Effect: Include the total effect of the independent variable on the dependent variable, encompassing both direct and indirect effects.
- Significance Tests: Present the results of the Sobel test or bootstrap confidence intervals to confirm the significance of the mediation effect.
- Model Fit: Discuss the overall fit of the mediation model and any relevant fit indices.
- Figures and Tables: Include tables and figures to visually represent the mediation pathways and statistical results.
- Discussion: Interpret the findings, highlighting the implications for theory and practice.
- Conclusion: Summarise the key results and suggest directions for future research.
Get Help For Your SPSS Analysis
Embark on a seamless research journey with SPSSAnalysis.com, where our dedicated team provides expert data analysis assistance for students, academicians, and individuals. We ensure your research is elevated with precision. Explore our pages;
- SPSS Help by Subjects Area: Psychology, Sociology, Nursing, Education, Medical, Healthcare, Epidemiology, Marketing
- Dissertation Methodology Help
- Dissertation Data Analysis Help
- Dissertation Results Help
- Pay Someone to Do My Data Analysis
- Hire a Statistician for Dissertation
- Statistics Help for DNP Dissertation
- Pay Someone to Do My Dissertation Statistics
Connect with us at SPSSAnalysis.com to empower your research endeavors and achieve impactful data analysis results. Get a FREE Quote Today!