Mean Imputation for Missing Data in SPSS
Discover Mean Imputation for Missing Data in SPSS! Learn how to perform, understand SPSS output, and report results in APA style. Check out this simple, easy-to-follow guide below for a quick read!
Struggling with Replacing Missing Values in SPSS! We’re here to help. We provide comprehensive support to academics and PhD students, encompassing assignments, dissertations, research, and additional services. Request Quote Now!
1. Introduction
Missing data is one of the most common issues encountered in real-world datasets. It can arise for various reasons, such as participant nonresponse, data entry errors, or skipped survey items. If not handled appropriately, missing values can introduce bias and reduce the statistical power of your analysis. One of the simplest techniques to address this issue is mean imputation, which replaces missing values with the mean of the observed values. In this guide, we’ll walk through what mean imputation is, when it’s appropriate, and how to perform it in SPSS.
2. What is Missing Data?
Missing data refers to the absence of information for one or more variables in a dataset. It can occur randomly or follow patterns, and it can be classified into three categories:
MCAR (Missing Completely at Random): The probability of missingness is unrelated to any observed or unobserved data.
MAR (Missing at Random): Missingness depends on other observed variables.
MNAR (Missing Not at Random): Missingness depends on the value itself or unobserved data.
Understanding the type of missingness is crucial for selecting an appropriate imputation strategy.
3. How to Handle Missing Data in SPSS
SPSS offers a variety of tools to address missing data, grouped into two main categories: single imputation and multiple imputation. Choosing the right approach depends on the amount of missingness, the underlying missing data mechanism (MCAR, MAR, MNAR), and the analysis goals.
I. Single Imputation Methods (via “Replace Missing Values” in SPSS)
These techniques substitute each missing value with a single estimate based on existing data:
Series Mean: Replaces all missing values in a variable with the overall mean of that variable. Best for normally distributed variables with low missingness.
Mean of Nearby Points: Uses the mean of adjacent (neighboring) values, which can be useful for time-series or ordered data.
Median of Nearby Points: Similar to the above, but uses the median instead of the mean, making it more robust to outliers.
Linear Interpolation: Fills in missing values using a straight line between two known data points. Works well when values are missing in the middle of a sequence.
Linear Trend at Point: Applies a linear regression model to predict the missing value at a specific point based on the trend of the variable across time or order.
These methods are quick and easy to implement, but they do not reflect uncertainty, and may bias standard errors or reduce variability in your dataset.
II. Multiple Imputation Methods (via “Multiple Imputation” in SPSS)
Unlike single imputation, multiple imputation creates several different plausible values for each missing data point, generating multiple complete datasets. The results from these datasets are then pooled for final analysis, allowing better estimation of uncertainty due to missing data. SPSS uses the MCMC and FCS (Fully Conditional Specification) frameworks to perform multiple imputation.
Here are the common methods:
FCS / MICE (Multiple Imputation by Chained Equations): This is the default in SPSS. Each variable with missing data is imputed conditionally based on a regression model using the other variables. This is flexible and supports both continuous and categorical data.
Best when data are Missing at Random (MAR) and the relationships among variables are important to preserve.
Predictive Mean Matching (PMM): A variation of regression imputation that ensures the imputed value is a realistic value from the observed dataset. It selects an observed value from cases with similar predicted values.
Useful when you want to avoid unrealistic or out-of-range imputed values.
Bayesian Estimation: Introduces randomness by sampling from a posterior distribution of parameters. This allows the imputations to reflect both model uncertainty and missingness.
Suitable for advanced users working under MAR assumptions or when modeling uncertainty is critical.
Multiple imputation is recommended when:
More than 5–10% of the data are missing
You assume data are MAR
You need valid inferences for regression, hypothesis testing, or model building
While more computationally intensive, multiple imputation provides more accurate standard errors and better preserves data relationships compared to single imputation.
4. Why Handling Missing Values Is Important in Statistical Analysis?
Failing to address missing data properly can lead to:
Biased estimates: If missingness is not random, ignoring it can distort your results.
Reduced statistical power: Loss of data means less information, resulting in wider confidence intervals and weaker significance.
Invalid assumptions: Many statistical models assume complete data. Violating this can compromise model validity.
By handling missing data thoughtfully—starting with an appropriate imputation strategy—you can ensure more reliable and interpretable results.
5. What does Imputation Mean for Missing Data in SPSS?
Mean imputation is a method that replaces all missing values in a variable with the arithmetic mean of the observed values. For example, if the observed ages in your dataset are 30, 35, 40, and two values are missing, the mean age of 35 will be used to fill those gaps.
This method is best suited for MCAR data or very small amounts of missingness. It is easy to implement, maintains sample size, and can be useful for quick summaries or simple models. However, it does reduce variance and can distort relationships between variables, so it should be used cautiously.
6. What Are the Assumptions of Mean Imputation?
Before using mean imputation, the following assumptions should be considered:
Data are Missing Completely at Random (MCAR): Mean imputation assumes the missing values are not related to any observed or unobserved data.
Low proportion of missing values: Typically under 5–10% missingness per variable is acceptable.
No strong skewness: The mean is sensitive to outliers, so this method is less suitable for skewed distributions.
Univariate imputation: Mean imputation does not account for relationships between variables and should not be used when multivariate associations are critical.
7. An Example for Mean Imputation
Imagine a dataset with 300 participants’ age values, where 5% of the age data is missing. The observed values range from 25 to 70, with a mean age of 45. Instead of deleting incomplete cases, mean imputation would fill the missing age values with 45, preserving the sample size and enabling basic analyses to proceed.


Step by Step: Running Mean Imputation in SPSS Statistics
Let’s embark on a step-by-step guide on performing the Replacement of Missing Values using SPSS
To apply mean imputation using SPSS:
1. Step: Go to Transform → Replace Missing Values.
2. Step: Select the variable with missing data (e.g., Age).
3. Step: Under “Method,” choose Series Mean.
4. Step: Click OK. SPSS will create a new variable (e.g., Age_1) with missing values replaced by the mean.
Other options available under the “Replace Missing Values” function include nearby point means, median, linear trend at point, and interpolation—but for mean imputation, choose “Series Mean.”
Note: Conducting Replacing Missing Values in SPSS provides a robust foundation for understanding the key features of your data. Always ensure that you consult the documentation corresponding to your SPSS version, as steps might slightly differ based on the software version in use.
This guide is tailored for SPSS version 25, and for any variations, it’s recommended to refer to the software’s documentation for accurate and updated instructions.
9. SPSS Output for Replacing Missing Values with the Mean


10. How to Interpret SPSS Output for Mean Imputation
SPSS does not produce a detailed output table for this operation. Instead, it generates a new variable (e.g., Age_1), and you can verify the replacement by:
Viewing the variable in Data View
Running Descriptive Statistics (Analyze → Descriptive Statistics → Descriptives) to confirm that missing values have been replaced
Comparing summary statistics of the original and imputed variables
You can also create a histogram or boxplot to visually inspect changes in distribution.
11. How to Report Mean Imputation Results
When you apply mean imputation in your analysis, it’s important to transparently explain how and why you used this method. This helps readers, reviewers, and collaborators understand your approach to handling missing data and assess the potential impact on your results.
Here’s what to include when reporting mean imputation in your research or academic writing:
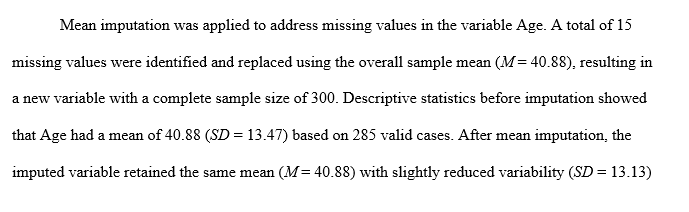
1. Mention the extent of missing data
Start by reporting the percentage of missing values for each variable where imputation was used. For example:
“The variable Age had 5% missing data.”
2. Justify the imputation method
Briefly explain why mean imputation was chosen. It’s important to state whether the missing data were assumed to be Missing Completely at Random (MCAR), since this is the main assumption for mean imputation.
“Because the proportion of missing data was low and assumed to be MCAR, mean imputation was used to replace missing values.”
3. Describe the method used
Clearly state which variable(s) were imputed and what value was used.
“Missing values for Age were replaced using the arithmetic mean of the observed values (M = 45.00).”
4. Acknowledge limitations
Mention any known limitations of mean imputation, especially its tendency to reduce variability or distort relationships between variables.
“Although mean imputation preserves sample size, it may underestimate variability and weaken correlations with other variables.”
Get Help For Your SPSS Analysis
Embark on a seamless research journey with SPSSAnalysis.com, where our dedicated team provides expert data analysis assistance for students, academicians, and individuals. We ensure your research is elevated with precision. Explore our pages;
- SPSS Help by Subjects Area: Psychology, Sociology, Nursing, Education, Medical, Healthcare, Epidemiology, Marketing
- Dissertation Methodology Help
- Dissertation Data Analysis Help
- Dissertation Results Help
- Pay Someone to Do My Data Analysis
- Hire a Statistician for Dissertation
- Statistics Help for DNP Dissertation
- Pay Someone to Do My Dissertation Statistics
Connect with us at SPSSAnalysis.com to empower your research endeavors and achieve impactful data analysis results. Get a FREE Quote Today!