Little’s MCAR in SPSS
Discover Little’s MCAR in SPSS! Learn how to perform, understand SPSS output, and report results in APA style. Check out this simple, easy-to-follow guide below for a quick read!
Struggling with MCAR in SPSS? We’re here to help. We provide comprehensive support to academics and PhD students, encompassing assignments, dissertations, research, and additional services. Request Quote Now!

1. Introduction
Missing data is a common challenge in statistical analysis, and how it is handled can substantially affect research validity. One of the first and most critical steps in managing missing data is to understand the mechanism behind it. Among these, Missing Completely at Random (MCAR) represents the most ideal scenario, where the likelihood of missingness is unrelated to any data, observed or unobserved. This post explains what MCAR is, how to test for it using SPSS, and why this assumption matters for imputation and statistical inference.
2. What is MCAR?
Data are said to be Missing Completely at Random (MCAR) when the probability of a value being missing is independent of both observed and unobserved data. In other words, the missingness occurs entirely by chance and is not systematically related to any variable in the dataset. If data are MCAR, removing incomplete cases through listwise deletion does not introduce bias, although it may reduce statistical power.
3. What is the MICE Mechanism?
MICE stands for Multiple Imputation by Chained Equations, also known as Fully Conditional Specification (FCS). Although MICE is not a missingness mechanism itself, it is a powerful technique for handling incomplete data—particularly when the assumption is Missing at Random (MAR). MICE iteratively fills in missing values for each variable using regression models based on other observed variables. While MICE can accommodate MCAR data, it is designed to perform well even under the more relaxed MAR assumption, making it a flexible imputation tool across missingness scenarios.
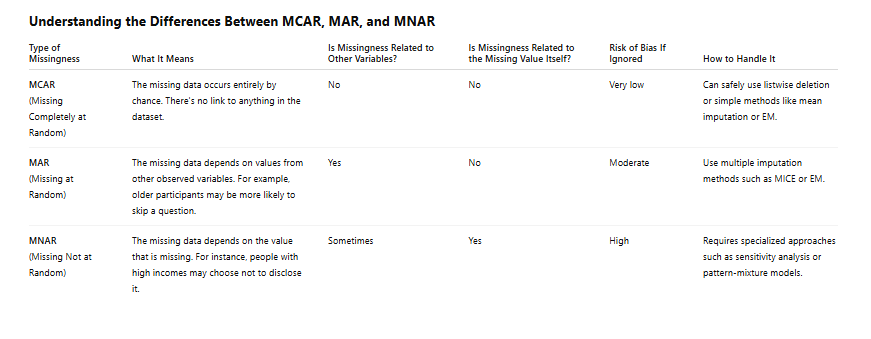
4. What Are the Differences Among MCAR, MAR, and MNAR?
Understanding the differences between missing data mechanisms is crucial for choosing the right analysis method:
I. Missing Completely at Random (MCAR)
In MCAR, the probability of a data point being missing is entirely unrelated to any observed or unobserved values. That means the missingness is purely random across the dataset. For example, a survey response might be missing because a participant accidentally skipped a question, not because of their demographic characteristics or attitudes. MCAR is the most restrictive and rare assumption but also the safest for analysis, as it permits the use of complete case (listwise deletion) methods without introducing bias.
II. Missing at Random (MAR)
In MAR, the probability of a value being missing is related to other observed variables, but not to the value that is missing itself. For example, suppose income is more likely to be missing for older individuals, but among individuals of the same age, the missingness of income is unrelated to the actual income values. In this case, missingness can be predicted using available data. MAR is a more realistic assumption in practice and is the basis for most multiple imputation methods, including MICE.
III. Missing Not at Random (MNAR)
In MNAR, the probability of missingness depends on the unobserved value itself. For instance, if people with very high income are less likely to report their income, and this tendency cannot be explained by other variables like age or education, the data are MNAR. This type of missingness is the most difficult to handle because standard imputation methods may produce biased results unless the missingness mechanism is explicitly modeled. Techniques such as selection models, pattern-mixture models, or sensitivity analysis are typically required.
5. How to Test MCAR in SPSS?
SPSS provides Little’s MCAR test, a statistical test that evaluates whether the pattern of missingness in your dataset is consistent with MCAR. This test is included in the Missing Value Analysis module.
To access it:
Go to
Analyze→Missing Value AnalysisMove variables of interest into the “Quantitative Variables” box
Under Display, check the box for “EM Means and Covariances”
Click OK
SPSS will output Little’s MCAR test, including a chi-square statistic, degrees of freedom, and a significance value.
6. Why MCAR Is Important for Data Imputation?
Knowing whether your data are MCAR is important because it directly informs how you handle missing values. If data are MCAR:
Listwise or pairwise deletion can be used without introducing bias
Simple imputation methods (e.g., mean, EM) are appropriate
Statistical results remain valid even when only complete cases are analyzed
However, if the MCAR assumption is violated, then more sophisticated techniques, such as multiple imputation or model-based methods, are necessary to avoid biased estimates.
7. What Does a Significant MCAR Test Mean?
Little’s MCAR test produces a chi-square statistic and a p-value:
p > .05: Fail to reject the null hypothesis. Data are likely MCAR.
p < .05: Reject the null hypothesis. Data are not MCAR (likely MAR or MNAR).
A non-significant result supports the use of deletion or simpler imputation strategies, whereas a significant result suggests that missingness may be systematic, and ignoring it could bias results.
8. An Example for MCAR in SPSS
Using the same example dataset as in earlier sections, which includes Age, Income, and Education Level for 300 individuals, missingness is present in 15% of Income values and 9% of Education Level values. To determine if these missing values occur completely at random, Little’s MCAR test is applied using SPSS’s Missing Value Analysis.

Step by Step: Running MCAR in SPSS Statistics
Let’s embark on a step-by-step guide on performing the Little’s MCAR Test using SPSS
1. Step: Open your dataset in SPSS and verify that missing values are correctly coded.
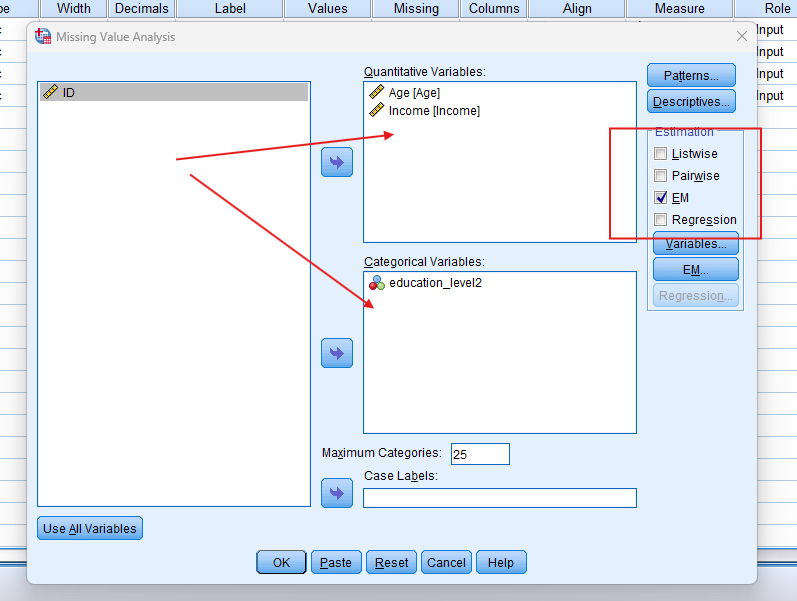
2. Step: Navigate to Analyze → Missing Value Analysis.
3. Step: Move numeric variables such as Age and Income into the “Quantitative” box. Categorical variables like Education Level (if coded numerically) can be included as well.
4. Step: Under “Estimation,” select EM and ensure “Display EM Means and Covariances” is checked.
5. Step: Click OK to run the analysis.
Note: Conducting MCAR in SPSS provides a robust foundation for understanding the key features of your data. Always ensure that you consult the documentation corresponding to your SPSS version, as steps might slightly differ based on the software version in use.
This guide is tailored for SPSS version 25, and for any variations, it’s recommended to refer to the software’s documentation for accurate and updated instructions.
9. SPSS Output for Little’s MCAR in SPSS


10. How to Interpret SPSS Output of the MCAR Test
After running the Missing Value Analysis in SPSS, the output window provides several important tables and diagnostic results. Here’s what each key section includes:
I. Variable Summary Table
This table lists each variable involved in the analysis along with:
The number of valid (non-missing) cases
The number and percentage of missing cases
Summary statistics (mean, standard deviation, min/max)
This table helps identify which variables have the highest proportion of missing data and may require targeted handling.
II. Descriptive Statistics Table
For numeric variables, this table presents:
Means and standard deviations of observed values
Estimates of means and standard deviations from the EM algorithm (if selected)
Comparison between observed and estimated values
This is useful for evaluating how imputation may affect central tendency and variability.
III. Patterns of Missing Data Table
This table shows all unique combinations of missing and non-missing data across variables (e.g., Case 1: missing Income only; Case 2: missing Education and Income). It highlights whether the pattern is:
Monotone: Missingness progresses in a consistent order (e.g., if one variable is missing, subsequent ones are too)
Arbitrary: No clear structure in the pattern of missingness
Monotone patterns are easier to handle in techniques like multiple imputation; arbitrary patterns require more flexible approaches like FCS (Fully Conditional Specification).
IV. Little’s MCAR Test
This chi-square test evaluates whether the data are Missing Completely At Random (MCAR). The test provides:
Chi-square statistic
Degrees of freedom (df)
p-value
A non-significant result (p > .05) suggests that the data are MCAR and that methods like listwise deletion or EM may be appropriate.
11. How to Report Results of Little’s MCAR Test in APA
In this example, Little’s MCAR test result is non-significant, χ²(1) = 3.71, p = .054, suggesting that the data are likely Missing Completely at Random. Although the result is marginal, it does not provide sufficient evidence to reject the MCAR assumption. This implies that imputation methods assuming MCAR—such as Expectation-Maximization or even listwise deletion—may be appropriate without introducing substantial bias.
However, the near-threshold p-value warrants caution. It is advisable to consider the context of data collection and examine variable-level patterns before deciding to proceed with deletion. If there is any suspicion of systematic missingness (e.g., income missing more often among older participants), using multiple imputation techniques that accommodate MAR would be a safer alternative.

Get Help For Your SPSS Analysis
Embark on a seamless research journey with SPSSAnalysis.com, where our dedicated team provides expert data analysis assistance for students, academicians, and individuals. We ensure your research is elevated with precision. Explore our pages;
- SPSS Help by Subjects Area: Psychology, Sociology, Nursing, Education, Medical, Healthcare, Epidemiology, Marketing
- Dissertation Methodology Help
- Dissertation Data Analysis Help
- Dissertation Results Help
- Pay Someone to Do My Data Analysis
- Hire a Statistician for Dissertation
- Statistics Help for DNP Dissertation
- Pay Someone to Do My Dissertation Statistics
Connect with us at SPSSAnalysis.com to empower your research endeavors and achieve impactful data analysis results. Get a FREE Quote Today!