Linear Mixed Model (LMM)
Discover the Linear Mixed Model in SPSS! Learn how to perform, understand SPSS output, and report results in APA style. Check out this simple, easy-to-follow guide below for a quick read!
Struggling with the Linear Mixed Model (LMM) using SPSS? We’re here to help. We offer comprehensive assistance to students, covering assignments, dissertations, research, and more. Request Quote Now!
1. Introduction
The Linear Mixed Model (LMM) is an extension of traditional linear models that accounts for both fixed and random effects. This makes it suitable for analysing data with complex structures, such as repeated measurements or hierarchical data (e.g., students nested within schools). LMMs provide a flexible approach to modelling relationships between variables while accounting for correlations within groups.
In SPSS, the Linear Mixed Model procedure allows you to handle data where observations are not independent, providing an effective solution when data involve nested, hierarchical, or repeated measures. This blog will explore the basics of LMMs, how to implement them in SPSS, and how to interpret the results.
2. What is the Linear Mixed Model in Statistics?
The Linear Mixed Model (LMM) is a statistical approach that generalises linear regression by incorporating both fixed effects, which apply to the entire population, and random effects, which account for variability at group or subject levels. Unlike ordinary linear regression, which assumes independence between observations, LMMs allow for correlation within clusters of data.
LMMs are particularly useful in cases where the data structure violates the assumptions of ordinary linear models, such as when data are collected repeatedly from the same subjects over time or when data are grouped within clusters. By modelling both fixed and random effects, LMMs provide a more accurate reflection of the underlying relationships in complex data.
3. What is the LMM Used For?
The Linear Mixed Model is ideal for analysing data where observations are nested within groups or repeated over time. It is commonly used in fields like healthcare, education, and social sciences. For example, it can model the effect of a treatment on patients, accounting for differences between hospitals or clinics. Similarly, in education, it can evaluate the impact of teaching methods while accounting for differences between schools.
LMMs are also used when data are unbalanced, meaning different groups have different numbers of observations. Unlike traditional models, LMMs can handle missing data and allow for unequal sample sizes, making them robust in real-world scenarios where perfect datasets are rare.
3a. What Type of Data is Suitable for LMM?
- Hierarchical Data: Observations nested within groups (e.g., patients within hospitals, students within schools).
- Repeated Measures: Data where the same subjects are measured multiple times over time.
- Longitudinal Data: Data where individuals are tracked across different points in time.
- Unbalanced Data: Data with unequal group sizes or missing observations.
3b. When to Use LMM
- When observations are not independent: Use LMM when data points are correlated due to repeated measures or hierarchical structures.
- When both fixed and random effects are present: Use LMM to capture both population-wide trends and individual or group variability.
3c. Covariance Type
The choice of covariance type defines how variability between random effects is modelled. In LMM, covariance types are crucial for accurately modelling random effects:
- Unstructured: Allows for different variances and covariances between random effects without any assumptions.
- Compound Symmetry: Assumes equal variances and covariances for random effects across time points.
- Autoregressive (AR1): Assumes correlations between observations decrease as the distance between them increases.
- Toeplitz: Allows correlations between random effects to decline but in a non-linear fashion.
4. What are Fixed, Random, and Mixed Effects in LMM?
- Fixed Effects: Represent the population-level effects, which apply consistently across all observations. These are the effects of interest (e.g., treatment effects).
- Random Effects: Represent individual or group-level variability. They allow the model to account for differences between clusters or subjects (e.g., hospital-to-hospital variation).
- Mixed Effects: Combine both fixed and random effects, allowing for a more flexible model that accounts for population-wide effects and individual differences.
Methods of REML and ML
- Restricted Maximum Likelihood (REML): Estimates the random effects first, then the fixed effects, providing unbiased estimates of the variance components.
- Maximum Likelihood (ML): Estimates both fixed and random effects simultaneously, often used when comparing models with different fixed effects.
5. Differences Among GLM, Regression, and Repeated ANOVA
- Generalized Linear Model (GLM): Extends linear regression to handle different types of data distributions (e.g., binomial, Poisson).
- Linear Regression: Models the relationship between a continuous dependent variable and one or more independent variables.
- Repeated Measures ANOVA: Compares means across multiple measurements from the same subjects over time or under different conditions.
6. Differences Among GLM, GLMM, and LMM
Understanding the differences between GLM, GLMM, and LMM helps researchers choose the correct model based on their data structure and research questions. Each of these models is designed for different types of data and effects.
- Generalized Linear Model (GLM): Models the relationship between variables for data following non-normal distributions, assuming independence of observations.
- Generalized Linear Mixed Model (GLMM): Extends GLM by including random effects to account for hierarchical or clustered data structures.
- Linear Mixed Model (LMM): Models normally distributed continuous data with fixed and random effects, handling grouped or repeated measures.
7. What are the Assumptions of the Linear Mixed Model?
Like any statistical model, LMM relies on certain assumptions to ensure valid results. We should check assumptions before interpreting the model results.
- The dependent variable is normally distributed (for LMM).
- The relationship between the dependent variable and independent variables is linear.
- The random effects are normally distributed.
- The observations are independent, conditional on the random effects.
- The model does not exhibit multicollinearity among fixed effects.
8. What is the Hypothesis of the LMM?
LMMs, like other statistical models, operate under hypotheses that help guide the analysis and interpretation of the data. These hypotheses focus on the effects of the independent variables and the variability captured by the random effects.
- Null Hypothesis (H₀): There is no significant relationship between the independent variables and the dependent variable, and the random effects do not contribute to the model.
- Alternative Hypothesis (H₁): There is a significant relationship between the independent variables and the dependent variable, and random effects contribute to the variability in the model.
9. An Example of the Linear Mixed Model
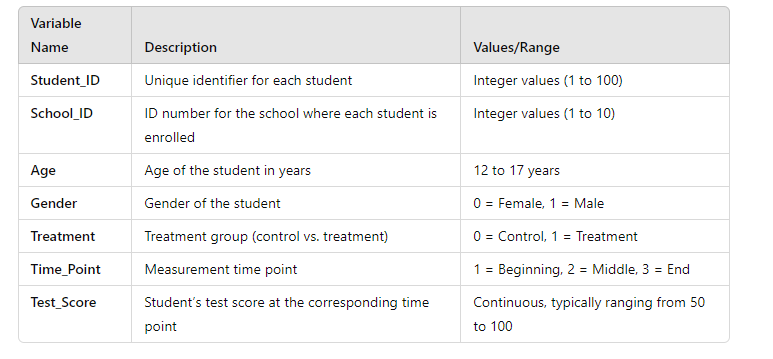
Suppose a researcher is studying the effect of a new educational programme on students’ test scores across 10 schools. We measure test scores at the beginning, middle, and end of the programme. In this scenario, an LMM could account for the hierarchical structure (students nested within schools) and repeated measures (test scores measured at three time points). The model would allow the researcher to examine both the fixed effect of the programme and the random effect of variability between schools.
10. How to Perform Linear Mixed Model (LMM) in SPSS


Step by Step: Running Linear Mixed Model in SPSS Statistics
Let’s embark on a step-by-step guide on performing the LMM using SPSS
- STEP: Load Data into SPSS
Commence by launching SPSS and loading your dataset, which should encompass the variables of interest – a categorical independent variable. If your data is not already in SPSS format, you can import it by navigating to File > Open > Data and selecting your data file.
- STEP: Access the Analyze Menu
In the top menu, click on Analyse > Mixed Models > Linear.
- STEP: Specify Variables
- Define the dependent variable (e.g., test scores) and move it to the dependent box.
- Add fixed effects (e.g., treatment, time) under the fixed effects section.
- Add random effects (e.g., school, patient ID) in the random effects section.
- STEP: Generate SPSS Output
- Click ‘OK’ after selecting your variables and method. SPSS will run the analysis and generate output tables and survival curves.
Note: Conducting the LMM in SPSS provides a robust foundation for understanding the key features of your data. Always ensure that you consult the documentation corresponding to your SPSS version, as steps might slightly differ based on the software version in use. This guide is tailored for SPSS version 25, and for any variations, it’s recommended to refer to the software’s documentation for accurate and updated instructions.
11. SPSS Output for Linear Mixed Model (LMM)


12. How to Interpret SPSS Output of Linear Mixed Model
SPSS will generate output, including the Model dimension, Information criteria, Type III Tests of Fixed Effects, Estimates of Fixed Effects, and Estimated of Marginal means
- Fixed Effects Table: Shows the parameter estimates, standard errors, and significance values for each fixed effect.
- Random Effects Table: Displays the variance components for random effects, indicating variability between clusters or subjects.
- Goodness-of-Fit Statistics: Includes measures like AIC and BIC to assess the overall model fit.
13. How to Report Results of Linear Mixed Model in APA
Reporting the results of the Linear Mixed Model (LMM) in APA (American Psychological Association) format requires a structured presentation. Here’s a step-by-step guide in list format:
- Introduction: Briefly describe the purpose of the analysis and the theoretical background.
- Method: Detail the data collection process, variables used, and the model specified.
- Results: Present the parameter estimates with their standard errors, and significance levels.
- Figures and Tables: Include relevant plots and tables, ensuring they are properly labeled and referenced.
- Discussion: Interpret the results, highlighting the significance of the findings and their implications.
- Conclusion: Summarise the main points and suggest potential areas for further research.

Get Support For Your SPSS Data Analysis
Embark on a seamless research journey with SPSSAnalysis.com, where our dedicated team provides expert data analysis assistance for students, academicians, and individuals. We ensure your research is elevated with precision. Explore our pages;
- Biostatistical Modeling Expert
- Statistical Methods for Clinical Studies
- Epidemiological Data Analysis
- Biostatistical Support for Researchers
- Clinical Research Data Analysis
- Medical Data Analysis Expert
- Biostatistics Consulting
- Healthcare Data Statistics Consultant
- SPSS Help by Subjects Area: Psychology, Sociology, Nursing, Education, Medical, Healthcare, Epidemiology, Marketing
Connect with us at SPSSAnalysis.com to empower your research endeavors and achieve impactful data analysis results. Get a FREE Quote Today!