Generalized Linear Mixed Model (GLMM)
Discover the Generalized Linear Mixed Model in SPSS! Learn how to perform, understand SPSS output, and report results in APA style. Check out this simple, easy-to-follow guide below for a quick read!
Struggling with the Generalized Linear Mixed Model in SPSS? We’re here to help. We offer comprehensive assistance to students, covering assignments, dissertations, research, and more. Request Quote Now!

1. Introduction
The Generalized Linear Mixed Model (GLMM) is an extension of the Generalized Linear Model (GLM) that incorporates both fixed and random effects. GLMMs allow for the modelling of complex data structures, such as those with repeated measures, hierarchical data, or clustered observations. This makes GLMM a versatile tool in fields like social sciences, medicine, and biology, where data often do not meet the assumptions of traditional linear models.
In SPSS, the GLMM procedure provides users with the ability to analyse data with random effects, which account for variability across groups or individuals. This flexibility helps to produce more accurate estimates in models that have both fixed and random effects, offering deeper insights into the data.
2. What is the Generalized Linear Mixed Model in Statistics?
The Generalized Linear Mixed Model (GLMM) is a highly versatile statistical model that combines features of both Generalized Linear Models (GLMs) and Mixed Models. It is designed to handle data with both fixed effects (factors that affect all observations) and random effects (factors that affect subsets of data, such as groups or individuals). GLMMs extend the functionality of GLMs by allowing for more complex data structures, such as hierarchical or repeated measures data.
In GLMM, the inclusion of random effects accounts for variability within different levels of the data, such as individual differences or group differences. This ability to model non-normal data distributions with added random effects makes GLMM ideal for analysing clustered or longitudinal data.
3. What is the GLMM Used For?
The Generalized Linear Mixed Model (GLMM) is used when the data structure includes both fixed and random effects, which is often the case in fields like medicine, psychology, and social sciences. GLMMs are particularly useful in situations where data are nested (e.g., students within schools, patients within hospitals), repeated over time, or when the dependent variable follows a non-normal distribution, such as binary, count, or categorical data.
Researchers use GLMM to model relationships while accounting for variation within groups, making it a robust tool for understanding complex data. It is also a preferred choice when there is a need to analyse repeated measures, clustered data, or data collected from different groups, where there is inherent variability across these levels.
3a. What Type of Data is Suitable for GLMM?
Generalized Linear Mixed Models (GLMMs) can handle a variety of data types, especially when observations are not independent. The types of data suitable for GLMM include the following:
- Hierarchical data: Data with observations nested within groups (e.g., students within schools).
- Repeated measures: Data where the same subjects are measured multiple times over time.
- Longitudinal data: Data that involve tracking individuals or units over time.
- Clustered data: Data with naturally occurring clusters (e.g., patients within hospitals).
- Non-normal distributions: Binary, count, or skewed continuous data.
3b. When to Use GLMM
There are specific conditions where GLMM is the most appropriate modelling choice. These conditions involve hierarchical or nested structures in the data, as well as situations where both fixed and random effects are present.
- When observations are not independent: Use GLMM when data points are correlated due to grouping or clustering (e.g., repeated measures, hierarchical structures).
- When both fixed and random effects are present: Use GLMM to account for both the overall effect (fixed) and variability across groups or individuals (random).
4. What are Fixed, Random, and Mixed Effects on GLMM?
In GLMM, understanding the difference between fixed, random, and mixed effects is crucial for correctly specifying your model. Fixed effects represent the overall population effect, while random effects capture individual or group variability. Mixed effects refer to models that incorporate both types.
- Fixed Effect: Represents population-level effects that are constant across individuals or groups. These are the primary variables of interest (e.g., treatment effects).
- Random Effect: Represents individual or group-level variability. Random effects allow for the modelling of differences across clusters or subjects.
- Mixed Effect: Combines both fixed and random effects in the model, allowing for a comprehensive analysis of data that incorporates both population-wide effects and individual variability.
4a. Define Repeated Covariance Type
The covariance structure of repeated measures within the GLMM plays a key role in how the model accounts for correlations between observations. Different covariance structures make different assumptions about how these correlations behave.
- Unstructured: No specific pattern is assumed for the variances and covariances.
- Compound Symmetry: Assumes constant variances and equal covariances across time points or repeated measures.
- Autoregressive (AR1): Assumes correlations between observations decrease as the time or distance between them increases.
- Toeplitz: Assumes that correlations decline but are allowed to vary by different lags.
- Diagonal: Assumes variances differ but no covariances exist between observations.
4b. Random Effect Covariance Type
Random effect covariance types describe the relationship between random effects and how their variability is modelled. Each type represents a different assumption about how the variability across groups or individuals is handled in the model.
- Variance Components: Estimates separate variance for each random effect.
- Unstructured: No assumptions are made about the covariance structure among random effects.
- Diagonal: Assumes random effects are independent, with no covariances between them.
- Compound Symmetry: Assumes constant variances and equal covariances for random effects.
5. Difference Between GLMM and Repeated Measure ANOVA
Both GLMM and Repeated Measures ANOVA are used to analyse data with repeated measurements, but they differ in several key ways. GLMMs are more flexible and can handle more complex data structures, making them suitable for a wider range of applications.
- GLMM allows for random effects: GLMM includes both fixed and random effects, while Repeated Measures ANOVA only accounts for fixed effects.
- GLMM handles non-normal data: GLMM can model binary, count, and other non-normal outcomes, whereas Repeated Measures ANOVA assumes normally distributed data.
- GLMM can handle unbalanced data: GLMM is suitable for unbalanced datasets, while Repeated Measures ANOVA requires balanced data.
6. Explain Differences Among GLM, GLMM, and LMM
Understanding the differences between GLM, GLMM, and LMM helps researchers choose the correct model based on their data structure and research questions. Each of these models is designed for different types of data and effects.
- Generalized Linear Model (GLM): Models the relationship between variables for data following non-normal distributions, assuming independence of observations.
- Generalized Linear Mixed Model (GLMM): Extends GLM by including random effects to account for hierarchical or clustered data structures.
- Linear Mixed Model (LMM): Models normally distributed continuous data with fixed and random effects, handling grouped or repeated measures.
7. What are the Assumptions of the Generalized Linear Mixed Model?
Like any statistical model, GLMM relies on certain assumptions to ensure valid results. These assumptions must be checked and met before interpreting the model results.
- The dependent variable follows a distribution from the exponential family (e.g., binomial, Poisson).
- The random effects are normally distributed.
- The relationship between the dependent variable and independent variables is defined by a link function.
- The observations are independent, conditional on the random effects.
- The model does not exhibit overdispersion (variance larger than expected under the assumed distribution).
8. What is the Hypothesis of the Generalized Linear Mixed Model?
GLMMs, like other statistical models, operate under hypotheses that help guide the analysis and interpretation of the data. These hypotheses focus on the effects of the independent variables and the variability captured by the random effects.
- Null Hypothesis (H₀): The independent variables do not have a significant effect on the dependent variable, and the random effects do not contribute to variability.
- Alternative Hypothesis (H₁): The independent variables significantly affect the dependent variable, and random effects contribute to the variability in the model.
9. An Example of the Generalized Linear Mixed Model
Imagine a study where researchers are investigating the effects of a new drug on blood pressure reduction in patients across multiple hospitals. The dependent variable is the reduction in blood pressure, the independent variable is the treatment type (drug vs placebo), and the random effect is the hospital where the patient is treated. A GLMM can account for the hierarchical structure (patients nested within hospitals) and assess the overall treatment effect while accounting for hospital-level variability.

In this example, a GLMM with a normal distribution and identity link could be used to model the continuous outcome (blood pressure reduction) while accounting for the random effect of hospital.


Step by Step: Running Generalized Linear Mixed Model in SPSS Statistics
Let’s embark on a step-by-step guide on performing the GLMM using SPSS
- STEP: Load Data into SPSS
Commence by launching SPSS and loading your dataset, which should encompass the variables of interest – a categorical independent variable. If your data is not already in SPSS format, you can import it by navigating to File > Open > Data and selecting your data file.
- STEP: Access the Analyze Menu
In the top menu, Go to Generalized Linear Mixed Models: In SPSS, click Analyse > Mixed Models > Generalized Linear Mixed Models.
- STEP: Specify Variables
- Select dependent and independent variables: Define your dependent variable and add your independent variables as fixed effects.
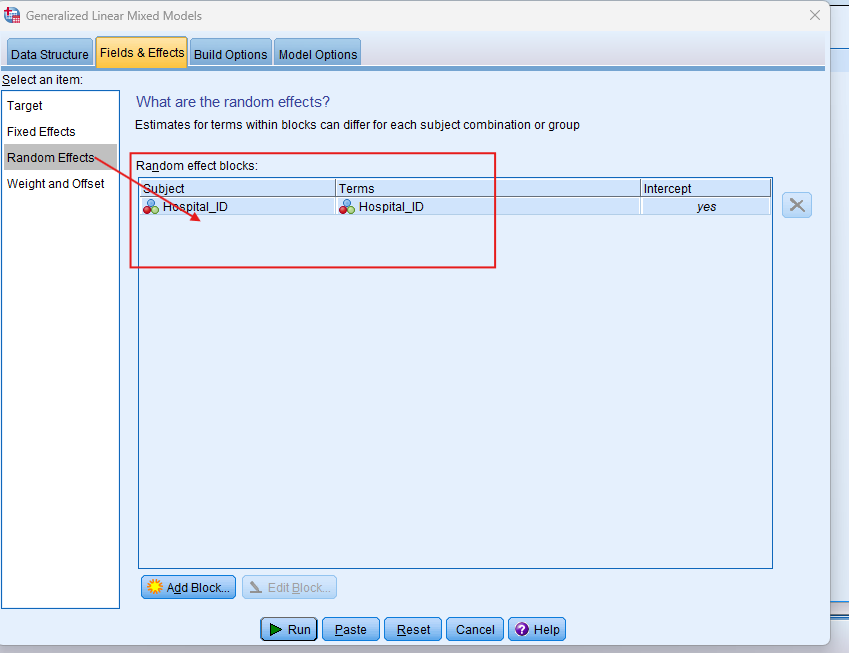
- Specify random effects: Choose your random effect, such as the grouping variable (e.g., hospital, class) in the Random tab.
- Set the model parameters: Choose the appropriate distribution (e.g., binomial for binary data) and link function.
- STEP: Generate SPSS Output
- Click ‘OK’ after selecting your variables and method. SPSS will run the analysis and generate output tables and survival curves.
Note: Conducting GLMM in SPSS provides a robust foundation for understanding the key features of your data. Always ensure that you consult the documentation corresponding to your SPSS version, as steps might slightly differ based on the software version in use. This guide is tailored for SPSS version 25, and for any variations, it’s recommended to refer to the software’s documentation for accurate and updated instructions.
11. SPSS Output for Generalized Linear Mixed Model


12. How to Interpret SPSS Output of Generalized Linear Mixed Model (GLMM)
SPSS will generate output, including Case Processing Summary, Fixed Effect Table, and Random Effect Table
- Model Information: Confirms the distribution and link function used in the analysis.
- Fixed Effects Table: Provides parameter estimates for the fixed effects, including coefficients, standard errors, and significance levels.
- Random Effects Table: Shows the variance components for random effects, indicating variability at the group level.
- Goodness-of-Fit: Includes statistics such as Deviance, AIC, and BIC, which help assess model fit.
- Wald Z Tests: Assesses the significance of the random effects and the fixed effects within the model.
13. How to Report Results of Generalized Linear Mixed Model (GLMM) in APA
Reporting the results of GLMM in APA (American Psychological Association) format requires a structured presentation. Here’s a step-by-step guide in list format:
- Introduction: Briefly describe the purpose of the analysis and the theoretical background.
- Method: Detail the data collection process, variables used, and the model specified.
- Results: Present the parameter estimates with their standard errors, and significance levels.
- Figures and Tables: Include relevant plots and tables, ensuring they are properly labelled and referenced.
- Discussion: Interpret the results, highlighting the significance of the findings and their implications.
- Conclusion: Summarise the main points and suggest potential areas for further research.

Get Support For Your SPSS Data Analysis
Embark on a seamless research journey with SPSSAnalysis.com, where our dedicated team provides expert data analysis assistance for students, academicians, and individuals. We ensure your research is elevated with precision. Explore our pages;
- Biostatistical Modeling Expert
- Statistical Methods for Clinical Studies
- Epidemiological Data Analysis
- Biostatistical Support for Researchers
- Clinical Research Data Analysis
- Medical Data Analysis Expert
- Biostatistics Consulting
- Healthcare Data Statistics Consultant
- SPSS Help by Subjects Area: Psychology, Sociology, Nursing, Education, Medical, Healthcare, Epidemiology, Marketing
Connect with us at SPSSAnalysis.com to empower your research endeavors and achieve impactful data analysis results. Get a FREE Quote Today!