Cox Regression Analysis
Discover Cox Regression Analysis in SPSS! Learn how to perform, understand SPSS output, and report results in APA style. Check out this simple, easy-to-follow guide below for a quick read!
Struggling with Cox Regression Analysis in SPSS? We’re here to help. We offer comprehensive assistance to students, covering assignments, dissertations, research, and more. Request Quote Now!
1. Introduction
Cox regression analysis, also known as the proportional hazards model, is a vital tool for analysing time-to-event data. In clinical trials, researchers use it to assess the effect of different variables on the timing of events like death or disease progression. Unlike other survival analysis methods, Cox regression can incorporate multiple covariates to give a more nuanced understanding of the factors that influence outcomes.
This blog post will guide you through the steps involved in performing Cox regression analysis in SPSS. You’ll learn about the model’s key concepts, its assumptions, and how to interpret and report the results. With a focus on SPSS, this article will help both beginners and experienced users understand the practical application of Cox regression in statistical analysis.
2. What is Cox Regression Analysis (Proportional Hazards Model) in Statistics?
Cox regression, or the proportional hazards model, is a semi-parametric statistical technique used to explore the relationship between the survival of individuals and one or more predictor variables (covariates). It estimates the hazard ratio for each covariate, which measures the effect of each variable on the hazard or risk of an event occurring. Importantly, the method assumes that the hazard ratios remain constant over time, hence the term “proportional hazards.”
Firstly, Cox regression allows researchers to account for censored data, making it ideal for survival analysis. Secondly, it handles both categorical and continuous covariates, making it flexible enough to model complex relationships between predictors and the outcome variable. This versatility is why Cox regression is widely used in medical, engineering, and social sciences.
3. Definition: Hazard Ratio, Proportional Hazards, Covariates, Censoring
- Hazard Ratio: A hazard ratio (HR) compares the hazard or risk of an event between two groups. A HR greater than 1 indicates an increased risk, while an HR less than 1 indicates a reduced risk.
- Proportional Hazards: This concept refers to the assumption that the ratio of hazards between groups remains constant over time. This is a key assumption in Cox regression.
- Covariates: Covariates are the independent variables that may affect the timing of the event. These can be categorical (e.g., treatment group) or continuous (e.g., age or blood pressure).
- Censoring: Censoring occurs when the event of interest has not happened by the end of the study or when the subject is lost to follow-up. Cox regression accounts for this by using all available data without biasing the results.
4. What is the Cox Regression Analysis used for?
Cox regression is widely used in medical and healthcare research to assess the impact of various treatments, patient characteristics, or risk factors on survival outcomes. Researchers use it to evaluate how factors like age, gender, and treatment type influence the risk of death or disease progression over time.
Additionally, the model is popular in fields such as engineering, where it helps estimate the lifespan of products or systems. In marketing, companies use Cox regression to predict customer churn, identifying factors that may lead to clients discontinuing services. The ability to include multiple covariates makes Cox regression a flexible and powerful tool for analysing time-to-event data in various disciplines.
5. Explain Differences among Survival Analysis, Kaplan-Meier, Cox Regression, and ROC Curve
- Survival Analysis: Survival analysis encompasses all statistical methods used to analyse time-to-event data. This includes models like Kaplan-Meier and Cox regression, among others.
- Kaplan-Meier Analysis: Kaplan-Meier is a non-parametric method that estimates survival probabilities over time without accounting for covariates. It generates survival curves that are useful for comparing groups.
- Cox Regression: Cox regression is a semi-parametric model that estimates the effect of covariates on survival while allowing for censored data. Unlike Kaplan-Meier, it adjusts for multiple covariates and gives hazard ratios.
- ROC Curve: The ROC (Receiver Operating Characteristic) curve is a graphical representation of a model’s performance in binary classification problems. It measures the trade-off between sensitivity and specificity, commonly used in diagnostic testing.
6. What are the Assumptions of the Cox Regression Analysis?
Before conducting Cox Regression, it is crucial to meet certain assumptions to ensure accurate results. By understanding and verifying these assumptions, researchers can make sure their findings are valid and reliable, here’s assumption of the cox regression;
- The hazard ratio between groups remains constant over time (proportional hazards assumption).
- The relationship between the covariates and the log of the hazard is linear.
- No significant time-dependent covariates (i.e., the covariates should not change over time).
- The model must correctly specify the functional form of continuous variables.
- Censoring must be independent of the likelihood of the event.
7. What is the Hypothesis of the Cox Regression Analysis?
In Cox regression, the null hypothesis typically states that there is no association between the covariates and the hazard of the event occurring. For example, in a clinical trial, the null hypothesis would suggest that the treatment has no effect on the time to an event, such as death or relapse.
The alternative hypothesis proposes that at least one covariate does influence the hazard of the event. Rejecting the null hypothesis implies that one or more covariates significantly impact the timing or likelihood of the event occurring, providing valuable insight into the factors that drive survival outcomes.
8. An Example of the Cox Regression Analysis
Consider a clinical study investigating whether a new drug prolongs survival compared to standard treatment. The time-to-event variable is the time (in months) until a patient either dies (event = 1) or is censored (event = 0). The covariates could include patient characteristics such as age, gender, and the treatment group (new drug = 1, standard = 0).
Researchers use Cox regression to estimate the hazard ratios for these covariates. For instance, if the hazard ratio for the treatment group is 0.70, it suggests that patients receiving the new drug have a 30% lower risk of death compared to those receiving standard treatment. By including age and gender, the model accounts for other factors that could influence survival, offering a clearer picture of the treatment’s effect.


Step by Step: Running Cox Regression Analysis in SPSS Statistics
Let’s embark on a step-by-step guide on performing the Cox Regression Analysis using SPSS
- STEP: Load Data into SPSS
Commence by launching SPSS and loading your dataset, which should encompass the variables of interest – a categorical independent variable. If your data is not already in SPSS format, you can import it by navigating to File > Open > Data and selecting your data file.
- STEP: Access the Analyze Menu
In the top menu, Go to ‘Analyse’ > ‘Survival’ > select ‘Cox Regression’ based on your objective.
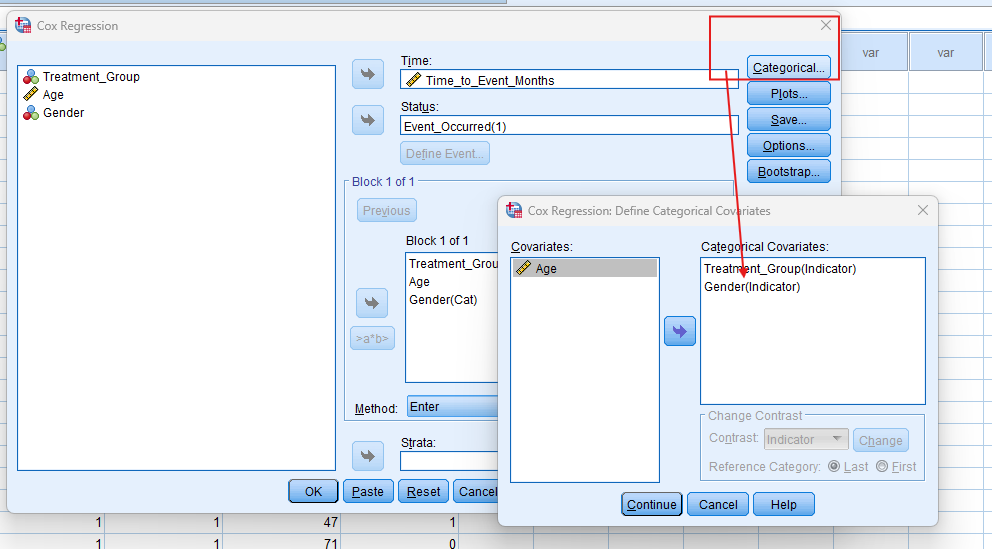
- STEP: Specify Variables
- For Cox Regression, specify time, event, and covariates to be included in the model. Select the time variable and the event variable (coded as 1 for event, 0 for censored). Add covariates such as treatment group, age, or gender.
- STEP: Generate SPSS Output
- Click ‘OK’ after selecting your variables and method. SPSS will run the analysis and generate output tables and survival curves.
Note: Conducting Cox Regression Analysis in SPSS provides a robust foundation for understanding the key features of your data. Always ensure that you consult the documentation corresponding to your SPSS version, as steps might slightly differ based on the software version in use. This guide is tailored for SPSS version 25, and for any variations, it’s recommended to refer to the software’s documentation for accurate and updated instructions.
SPSS Output for Cox Regression Analysis


9. How to Interpret SPSS Output of Cox Regression Analysis
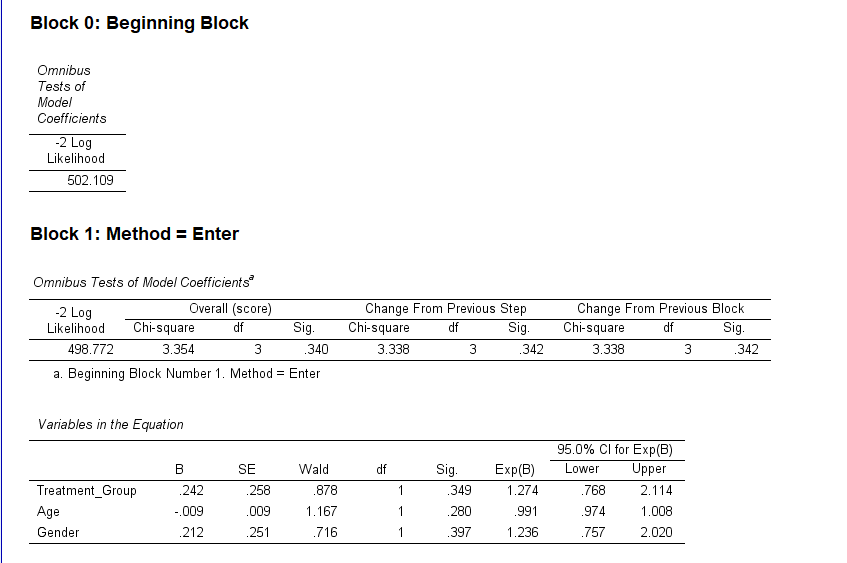
SPSS will generate output, including Case Processing Summary, Omnibus Tests of Model Coefficients, Covariate Means and Pattern Values, and Survival Function Plot
- Cox Regression Output:
- Model Summary: Reports the overall model fit, including -2 Log Likelihood, AIC, and BIC.
- Proportional Hazards Test: Confirms whether the proportional hazards assumption holds (important for valid results).
- Covariates Table: Displays the hazard ratios for each covariate, with confidence intervals and p-values. A hazard ratio greater than 1 suggests an increased risk, while less than 1 indicates a reduced risk.
- Overall Model Test: Includes likelihood ratio, Wald, and score (log-rank) tests, showing the significance of the overall model.
- Proportional Hazards Test: Confirms whether the proportional hazards assumption is met.
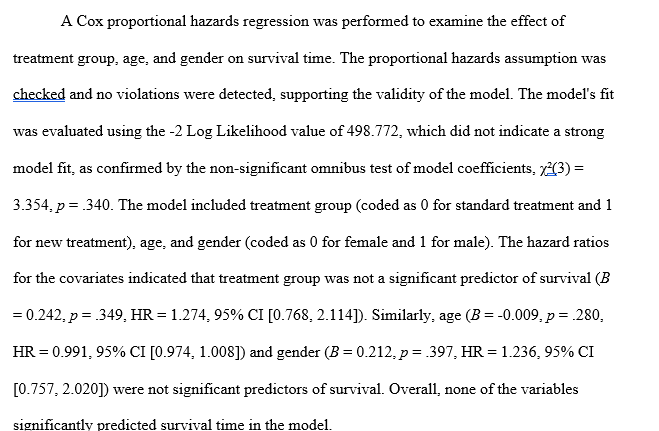
10. How to Report Results of Cox Regression Analysis in APA
Reporting the results of cox regression in APA (American Psychological Association) format requires a structured presentation. Here’s a step-by-step guide in list format:
- Introduction: Briefly describe the purpose of the analysis and the theoretical background.
- Method: Detail the data collection process, variables used, and the model specified.
- Results: Present the parameter estimates with their standard errors, and significance levels.
- Figures and Tables: Include relevant plots and tables, ensuring they are properly labelled and referenced.
- Discussion: Interpret the results, highlighting the significance of the findings and their implications.
- Conclusion: Summarise the main points and suggest potential areas for further research.
Get Support For Your SPSS Data Analysis
Embark on a seamless research journey with SPSSAnalysis.com, where our dedicated team provides expert data analysis assistance for students, academicians, and individuals. We ensure your research is elevated with precision. Explore our pages;
- Biostatistical Modeling Expert
- Statistical Methods for Clinical Studies
- Epidemiological Data Analysis
- Biostatistical Support for Researchers
- Clinical Research Data Analysis
- Medical Data Analysis Expert
- Biostatistics Consulting
- Healthcare Data Statistics Consultant
- SPSS Help by Subjects Area: Psychology, Sociology, Nursing, Education, Medical, Healthcare, Epidemiology, Marketing
Connect with us at SPSSAnalysis.com to empower your research endeavors and achieve impactful data analysis results. Get a FREE Quote Today!