Chi-Square Goodness-of-Fit Test
Discover the Chi-Square Goodness-of-Fit Test in SPSS! Learn how to perform, understand SPSS output, and report results in APA style. Check out this simple, easy-to-follow guide below for a quick read!
Struggling with the Chi-Squared Test in SPSS? We’re here to help. We offer comprehensive assistance to students, covering assignments, dissertations, research, and more. Request Quote Now!
1. Introduction
The Chi-Square Goodness-of-Fit Test is a statistical method used to compare observed data with expected data based on a theoretical distribution. This test helps determine whether the observed frequencies in one or more categories match the expected frequencies. Researchers often use this test to evaluate how well their sample data fits a particular distribution, such as a uniform or normal distribution.
In this blog post, we will explore the Chi-Square Goodness-of-Fit Test and its application in SPSS. We will cover the fundamentals of the test, its assumptions, and hypotheses, as well as guide you through the steps of performing the test in SPSS.
2. What is the Chi-Square Goodness-of-Fit Test in Statistics?
The Chi-Square Goodness-of-Fit Test is a non-parametric test that evaluates how well the observed data fit a specified theoretical distribution. The test works by comparing the observed frequencies in each category with the expected frequencies, which are calculated based on a hypothesized distribution. The test then calculates the difference between the observed and expected values to see if any significant deviation exists.
This test is particularly useful when researchers want to determine whether their data follows a known distribution, such as the expected proportion of different colours in a set of M&Ms or the distribution of voters’ preferences across political parties based on a previous election result. By comparing observed frequencies with theoretical ones, the test provides a statistical measure of fit.
3. What is the Formula for the Chi-Square Test?
The formula for the Chi-Square Goodness-of-Fit Test is:
χ2=∑(O−E)2E\chi^2 = \sum \frac{(O – E)^2}{E}
Where:
- O represents the observed frequency for each category.
- E represents the expected frequency for each category, assuming no association between the variables.
The formula calculates how far the observed counts deviate from the expected counts under the null hypothesis of no association. The test result is compared against the Chi-Squared distribution to determine statistical significance.
4. What is the Chi-Square Test used for?
The Chi-Square Goodness-of-Fit Test is primarily used to test whether a sample matches a specific distribution. For example, in genetics, this test can be used to check if observed ratios of different traits in offspring match the expected ratios according to Mendelian inheritance. Similarly, marketers use this test to compare observed customer preferences with expected preferences based on market research.
In essence, this test is valuable for assessing whether the observed data deviate from a known theoretical distribution, providing a way to validate or challenge assumptions about the population distribution.
5. Explain Differences among Chi-Square Tests of Independence, Goodness Fit, Association, Fisher’s Exact, and Homogeneity
- Chi-Square Test for Association: Determines if two categorical variables are associated or independent by comparing observed and expected frequencies in a contingency table.
- Chi-Square Test of Independence: Similar to the test for association, it assesses whether two variables are independent. The key difference lies in the context of the research question, with independence tests often focusing on whether the distribution of one variable is unaffected by the other.
- Chi-Square Goodness-of-Fit Test: Compares observed frequencies of a single categorical variable to a theoretically expected distribution. Researchers use it to determine if a sample fits a specific distribution.
- Chi-Square Test of Homogeneity: Tests whether two or more groups are homogeneous in terms of the distribution of a categorical variable. This test is used to compare the proportions across different populations.
- Fisher’s Exact Test: Fisher’s Exact Test is an alternative to the Chi-Squared test for 2×2 contingency tables, especially when sample sizes are small or when expected frequencies are less than 5. Unlike the Chi-Squared test, Fisher’s Exact Test provides an exact p-value, making it more accurate when dealing with small or sparse data. It is particularly useful when the assumptions of the Chi-Squared test are not met.
6. What are the Assumptions of the Chi-Square Test?
Before performing the Chi-Square Goodness-of-Fit Test, researchers must ensure that certain assumptions are met. Failing to meet these assumptions may lead to inaccurate results, so it is essential to understand and verify them before proceeding with the analysis.
- The data must consist of one categorical variable with two or more levels.
- The sample must be random and representative of the population.
- The expected frequency for each category should be 5 or greater.
- The observations must be independent of one another.
Ensuring these assumptions are met is crucial to obtaining accurate and reliable results from the Chi-Square Goodness-of-Fit Test.
7. What is the Hypothesis of the Chi-Square Test?
The hypotheses for the Chi-Square Goodness-of-Fit Test are as follows:
- Null Hypothesis (H₀): The observed data follow the specified theoretical distribution. This implies that the observed frequencies match the expected frequencies based on the hypothesised distribution.
- Alternative Hypothesis (H₁): The observed data do not follow the specified theoretical distribution. This suggests that the observed frequencies significantly differ from the expected frequencies.
Rejecting the null hypothesis would indicate that the sample data do not fit the theoretical distribution.
8. An Example of the Chi-Square Goodness-of-Fit Test
Imagine a researcher wants to determine whether the distribution of four different types of fruit sold at a supermarket matches the expected market share. The expected distribution is 25% for apples, 25% for bananas, 25% for oranges, and 25% for grapes. However, the researcher collects data from the supermarket and finds different proportions of fruit sales.
The researcher performs the Chi-Square Goodness-of-Fit Test to compare the observed frequencies with the expected 25% distribution for each fruit type. The test will reveal whether the observed sales significantly deviate from the expected proportions.
9. How to Perform Chi Square Goodness-of-Fit Test in SPSS

Step by Step: Running Chi-Square Goodness-of-Fit Test in SPSS Statistics
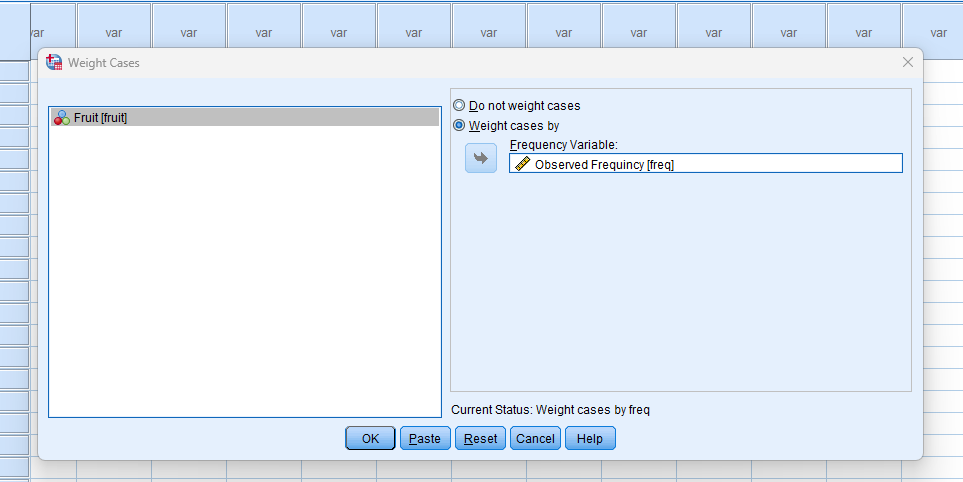
Steps to Weight Data in SPSS:
- Open your dataset in SPSS.
- Go to the top menu and click on Data > Weight Cases.
- In the dialog box, select Weight cases by and choose the variable that contains the weights (e.g., frequency or count variable).
- Click OK to apply the weight to your dataset.
- SPSS will now treat each case as if it appears according to the weight value when conducting statistical analyses.
Steps to Conducting the Test in SPSS:
Let’s embark on a step-by-step guide on performing the Chi-Square Goodness-of-Fit Test using SPSS
- STEP: Load Data into SPSS
Commence by launching SPSS and loading your dataset, which should encompass the variables of interest – a categorical independent variable. If your data is not already in SPSS format, you can import it by navigating to File > Open > Data and selecting your data file.
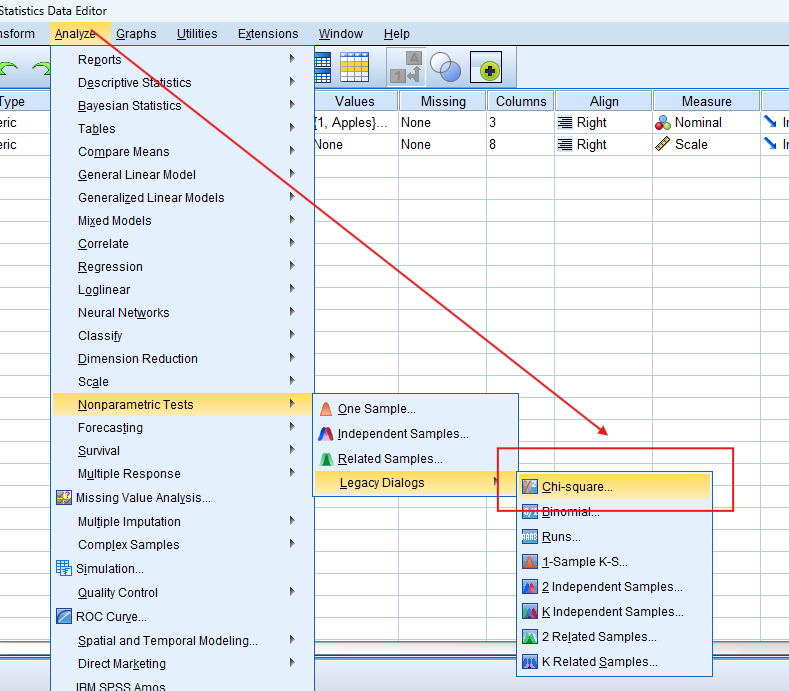
- STEP: Access the Analyze Menu
In the top menu, In SPSS, click on Analyse > Nonparametric Tests > Legacy Dialogues > Chi-Square.
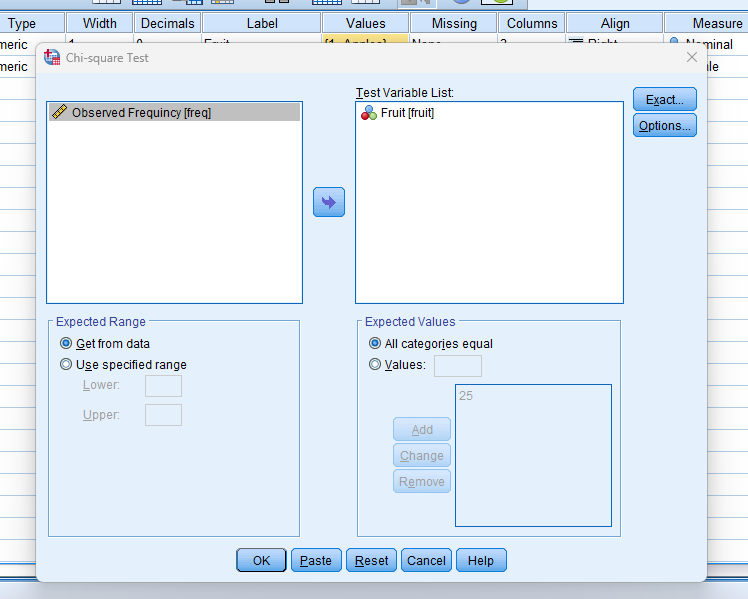
- STEP: Specify Variables
- Select the variable for which you want to perform the Goodness-of-Fit Test. Enter the expected proportions for each category under the “Expected Values” section if your expected distribution is not equal.
- STEP: Generate SPSS Output
- Click ‘OK’ after selecting your variables and method. SPSS will run the analysis and generate output tables and survival curves.
Note: Conducting the Chi-Square Goodness-of-Fit Test in SPSS provides a robust foundation for understanding the key features of your data. Always ensure that you consult the documentation corresponding to your SPSS version, as steps might slightly differ based on the software version in use. This guide is tailored for SPSS version 25, and for any variations, it’s recommended to refer to the software’s documentation for accurate and updated instructions.
SPSS Output for Chi Square Goodness-of-Fit Test
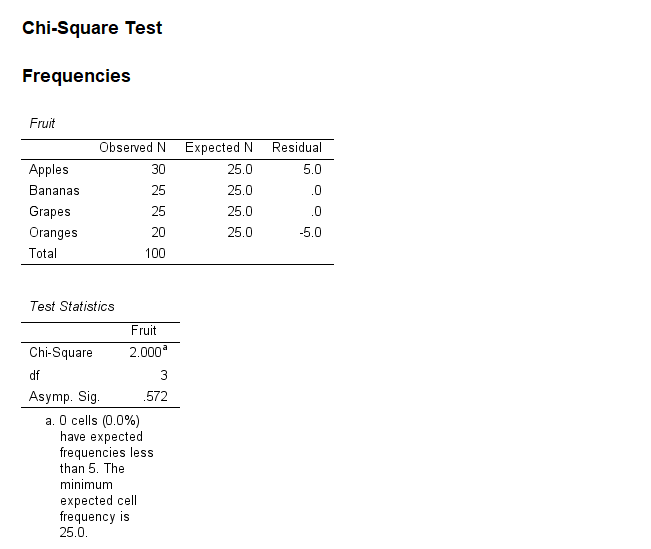
10. How to Interpret SPSS Output of Chi-Square Goodness-of-Fit Test
SPSS will generate output, including the Frequinces, Test Statistics
- Chi-Squared Test Table: This table provides the Chi-Square statistic, degrees of freedom (df), and the p-value. If the p-value is less than the chosen significance level (commonly 0.05).
- Expected and Observed Frequencies Table: This table shows the expected frequencies under the hypothesised distribution alongside the observed frequencies. This helps in identifying any notable differences between the two.
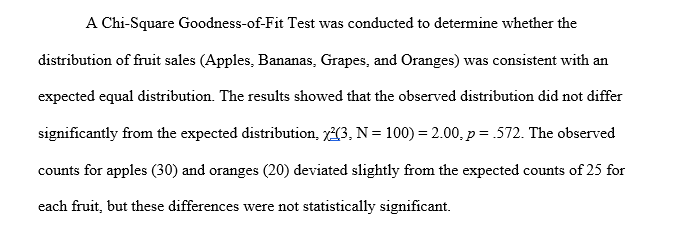
11. How to Report Results of Chi-Square Goodness-of-Fit Test in APA
Reporting the results of chi square Goodness-of-Fit Test in APA (American Psychological Association) format requires a structured presentation. Here’s a step-by-step guide in list format:
- Introduction: Briefly describe the purpose of the analysis and the theoretical background.
- Method: Detail the data collection process, variables used, and the model specified.
- Results: Present the parameter estimates with their standard errors, and significance levels.
- Figures and Tables: Include relevant plots and tables, ensuring they are properly labeled and referenced.
- Discussion: Interpret the results, highlighting the significance of the findings and their implications.
- Conclusion: Summarise the main points and suggest potential areas for further research.
Get Support For Your SPSS Data Analysis
Embark on a seamless research journey with SPSSAnalysis.com, where our dedicated team provides expert data analysis assistance for students, academicians, and individuals. We ensure your research is elevated with precision. Explore our pages;
- Biostatistical Modeling Expert
- Statistical Methods for Clinical Studies
- Epidemiological Data Analysis
- Biostatistical Support for Researchers
- Clinical Research Data Analysis
- Medical Data Analysis Expert
- Biostatistics Consulting
- Healthcare Data Statistics Consultant
- SPSS Help by Subjects Area: Psychology, Sociology, Nursing, Education, Medical, Healthcare, Epidemiology, Marketing
Connect with us at SPSSAnalysis.com to empower your research endeavors and achieve impactful data analysis results. Get a FREE Quote Today!