Confirmatory Factor Analysis in SPSS AMOS
Discover Confirmatory Factor Analysis in SPSS-AMOS! Learn how to perform, understand SPSS output, and report results in APA style. Check out this simple, easy-to-follow guide below for a quick read!
Struggling with Confirmatory Factor Analysis in SPSS? We’re here to help. We offer comprehensive assistance to students, covering assignments, dissertations, research, and more. Request Quote Now!

Introduction
Confirmatory Factor Analysis (CFA) stands as a cornerstone in structural equation modelling, especially when using SPSS AMOS. This statistical technique verifies factor structures hypothesized by the researcher, making it an essential tool in various fields, including psychology, education, and market research. Understanding CFA’s intricacies ensures that your model accurately reflects the underlying data structure, thereby enhancing the validity and reliability of your findings.
For those new to this domain, SPSS AMOS provides a user-friendly platform to perform CFA, integrating graphical interface capabilities with powerful statistical computations. This blog post will delve into the essential aspects of Confirmatory Factor Analysis using SPSS AMOS, covering everything from fundamental concepts to detailed steps for execution. By the end, you will be equipped with the knowledge to conduct and interpret CFA effectively.
What is Confirmatory Factor Analysis (CFA)?
Confirmatory Factor Analysis (CFA) serves as a statistical technique used to test the hypothesis that a relationship between observed variables and their underlying latent constructs exists. Unlike Exploratory Factor Analysis (EFA), CFA requires a pre-defined structure based on theory or prior research. This aspect makes CFA particularly useful in validating the construct validity of a measurement instrument.
CFA operates on the premise that the researcher specifies the number of factors and the variables that load onto each factor beforehand. This approach allows for the testing of hypotheses regarding the factor structure, including the relationships between latent constructs. Ultimately, CFA helps in refining measurement models, ensuring that they accurately capture the intended constructs.
What is SPSS AMOS?
SPSS AMOS, an extension of the SPSS software package, stands for Analysis of Moment Structures. It is designed specifically for structural equation modelling, providing a robust platform for performing CFA. SPSS AMOS combines a powerful graphical interface with advanced statistical capabilities, making it accessible for both novice and experienced researchers.
Firstly, SPSS AMOS allows users to draw path diagrams that visually represent hypothesized relationships between variables. Secondly, it performs complex calculations required for CFA, including estimation of factor loadings, variance, and error terms. This dual functionality makes SPSS AMOS an invaluable tool for researchers aiming to conduct sophisticated data analyses without needing extensive programming skills.
What are Mode Fit Indices for CFA?
Mode fit indices are crucial in evaluating the goodness-of-fit of a CFA model. These indices help determine how well the proposed model fits the observed data. Key fit indices include:
- Chi-Square (Chisq): Assesses the discrepancy between the observed and expected covariance matrices. A smaller, non-significant value indicates a better fit.
- Goodness of Fit Index (GFI): Measures the proportion of variance accounted for by the estimated population covariance. Values closer to 1 suggest a good fit.
- Normed Fit Index (NFI): Compares the fit of the target model to a null model. Values above 0.90 generally indicate an acceptable fit.
- Comparative Fit Index (CFI): Evaluates the model fit by comparing the target model to an independent null model. Values above 0.95 are indicative of an excellent fit.
- Relative Fit Index (RFI): Adjusts the NFI for model complexity. Higher values indicate a better fit, with values above 0.90 considered acceptable.
- Incremental Fit Index (IFI): Similar to CFI, but takes model complexity into account. Values above 0.90 signify a good fit.
- Root Mean Square Error of Approximation (RMSEA): Estimates the amount of error of approximation per degree of freedom. Values below 0.06 indicate a close fit, while values up to 0.08 are considered acceptable.
- Standardized Root Mean Square Residual (SRMR): Represents the average discrepancy between observed and predicted correlations. Values less than 0.08 are generally indicative of a good model fit.
Understanding these fit indices helps researchers evaluate and improve their CFA models, ensuring they accurately represent the underlying data structure.
What are the Acceptable Fit Indices for CFA?
Acceptable fit indices provide benchmarks for determining whether a CFA model adequately fits the data. Generally, a good fit is indicated by a Chi-Square (Chisq) value that is non-significant, although this is sensitive to sample size. Goodness of Fit Index (GFI) and Adjusted Goodness of Fit Index (AGFI) values should exceed 0.90 for a good fit.

Comparative Fit Index (CFI) and Tucker-Lewis Index (TLI) values above 0.95 indicate an excellent fit, while values above 0.90 are considered acceptable. Root Mean Square Error of Approximation (RMSEA) values below 0.06 indicate a close fit, with values up to 0.08 representing a reasonable error of approximation. Standardized Root Mean Square Residual (SRMR) values less than 0.08 are generally indicative of a good model fit.
What is the Difference Between EFA and CFA in SPSS?
Exploratory Factor Analysis (EFA) and Confirmatory Factor Analysis (CFA) serve different purposes in SPSS. EFA is used when the researcher has no preconceived notion about the structure or number of factors underlying the data. It is exploratory in nature, aiming to identify potential underlying structures without prior hypotheses.
In contrast, CFA is confirmatory, used to test hypotheses about the structure of the data based on existing theory or research. Unlike EFA, CFA requires the researcher to specify the number of factors and the relationship between observed variables and these factors beforehand. This distinction makes CFA a more rigorous and hypothesis-driven approach compared to EFA.
What are the Assumptions of Confirmatory Factor Analysis?
- Linearity: Relationships between observed and latent variables must be linear.
- Multivariate normality: Data should follow a multivariate normal distribution.
- No multicollinearity: Observed variables should not be highly correlated.
- Adequate sample size: Generally, a sample size of at least 200 is recommended.
- Measurement level: Variables should be continuous or at least ordinal.
- Model specification: The hypothesized model must be correctly specified.
- Identifiability: The model should have enough data points to produce unique parameter estimates.
What is the Hypothesis of Confirmatory Factor Analysis?
The primary hypothesis of Confirmatory Factor Analysis posits that the observed variables represent the underlying latent constructs as specified in the model. This involves testing whether the data fits the hypothesized measurement model, where each observed variable loads significantly onto the corresponding latent factor.
Secondly, CFA hypotheses often include specific relationships between factors, such as correlations or causal paths. Researchers hypothesize that these relationships will be significant and in the expected direction. Confirming these hypotheses strengthens the validity of the measurement model and supports the theoretical framework underpinning the research.
An Example of Confirmatory Factor Analysis
Consider a study aiming to understand the factors that influence student satisfaction with their university experience. Researchers design a questionnaire with 10 items, covering aspects such as academic quality, campus facilities, social life, and support services. To uncover the latent factors underlying these items, they decide to conduct an Confirmatory Factor Analysis (CFA) using SPSS AMOS.
Using SPSS AMOS, researchers draw a path diagram specifying that certain survey items load onto each of the three factors. After running the analysis, they examine the fit indices to determine if the model fits the data well. If the indices show a good fit, researchers confirm that the survey items validly measure the three hypothesized constructs, thus supporting their theoretical model.
How to Perform Confirmatory Factor Analysis in SPSS AMOS


Step by Step: Running Confirmatory Factor Analysis in AMOS
Let’s embark on a step-by-step guide on performing the Confirmatory Factor Analysis using AMOS
- Open SPSS AMOS and create a new project.
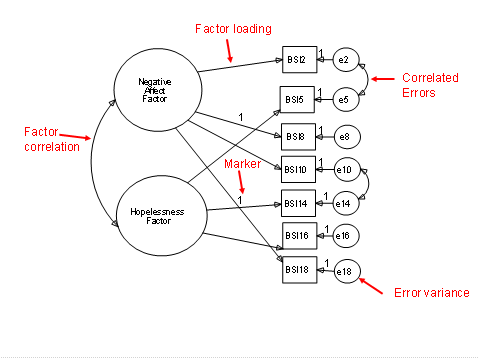
- Draw the hypothesized model using the path diagram interface.
- Define the latent variables and assign observed variables to each.
- Specify the relationships between the variables, including factor loadings and error terms.
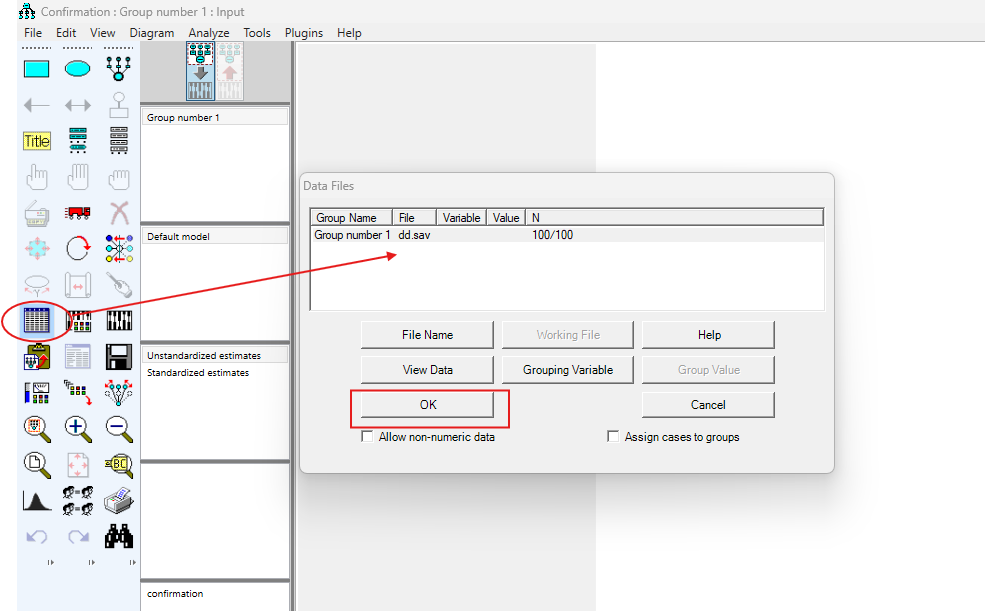
- Load the dataset into AMOS and link it to the model.
- Set the analysis options, including estimation methods and fit indices.
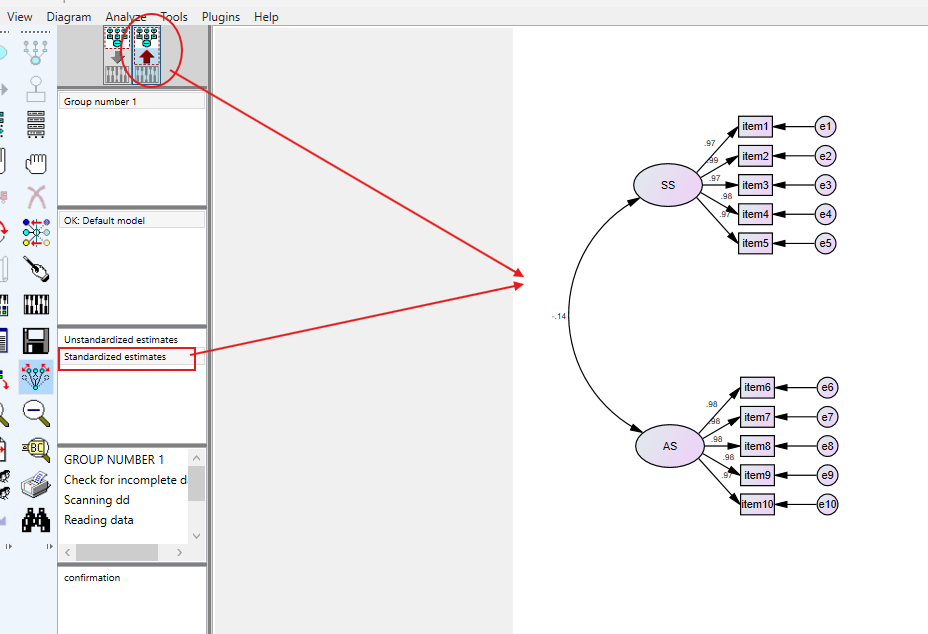
- Run the analysis and examine the output for fit indices and parameter estimates.
These steps guide you through setting up and executing a CFA model in SPSS AMOS, ensuring a thorough and systematic approach to your analysis.
SPSS AMOS Output for Factor Analysis


How to Interpret SPSS AMOS Output of Factor Analysis
Interpreting the output of CFA in SPSS AMOS involves several key steps. Firstly, check the model fit indices such as Chi-Square, GFI, CFI, and RMSEA to assess overall model fit. Values within acceptable ranges indicate a good fit between the model and the data.
Secondly, examine the factor loadings for each observed variable. These should be significant and ideally greater than 0.5, indicating that the variables strongly represent the underlying latent constructs. Additionally, review the error terms and modification indices to identify any areas where the model could be improved. Proper interpretation of these outputs provides a comprehensive understanding of the model’s validity and reliability.
How to Report Results of Confirmatory Factor Analysis in APA
- State the purpose of the CFA and the hypothesized model.
- Describe the sample and data collection methods.
- Provide details on the model specification, including the number of factors and observed variables.
- Report the fit indices (Chisq, GFI, CFI, RMSEA, etc.) and their values.
- Present the factor loadings and their significance levels.
- Discuss the overall fit of the model and any modifications made.
- Conclude with implications of the findings and suggestions for future research.
By following these guidelines, you ensure a clear and concise presentation of your CFA results, adhering to APA standards.

Get Help For Your SPSS Analysis
Embark on a seamless research journey with SPSSAnalysis.com, where our dedicated team provides expert data analysis assistance for students, academicians, and individuals. We ensure your research is elevated with precision. Explore our pages;
- SPSS Help by Subjects Area: Psychology, Sociology, Nursing, Education, Medical, Healthcare, Epidemiology, Marketing
- Dissertation Methodology Help
- Dissertation Data Analysis Help
- Dissertation Results Help
- Pay Someone to Do My Data Analysis
- Hire a Statistician for Dissertation
- Statistics Help for DNP Dissertation
- Pay Someone to Do My Dissertation Statistics
Connect with us at SPSSAnalysis.com to empower your research endeavors and achieve impactful data analysis results. Get a FREE Quote Today!