Two-Way MANOVA in SPSS
Discover Two-Way MANOVA in SPSS! Learn how to perform, understand SPSS output, and report results in APA style. Check out this simple, easy-to-follow guide below for a quick read!
Struggling with the Two-Way MANOVA Test in SPSS? We’re here to help. We offer comprehensive assistance to students, covering assignments, dissertations, research, and more. Request Quote Now!
Introduction
A Two-Way MANOVA allows for simultaneous exploration of the impact of two independent variables on multiple dependent variables, offering a nuanced perspective beyond univariate analyses. In this exploration of Two-Way MANOVA, we will unravel its definition, explore its assumptions, guide you through a practical example, and provide a step-by-step tutorial on its execution in SPSS. Whether you are a seasoned statistician or delving into multivariate analyses for the first time, this post aims to demystify Two-Way MANOVA, empowering you to navigate statistical complexities with confidence.
Definition
At its essence, Two-Way MANOVA is a statistical method employed to examine the influence of two independent variables on the multivariate pattern of multiple dependent variables. This method extends beyond the univariate approach, allowing researchers to not only investigate the main effects of each independent variable but also explore whether there is an interaction effect between them. In simpler terms, it answers questions such as how two factors individually impact a set of variables and whether their combined influence results in a significant interaction. Two-way MANOVA is particularly valuable when dealing with scenarios where the interplay between two distinct factors may contribute to variations observed across a spectrum of dependent variables. As we progress, we will delve into the assumptions critical for the application of Two-Way MANOVA, followed by a real-world example and a comprehensive guide on executing and interpreting the analysis using SPSS.
Assumptions of the Two-Way MANOVA Test
Before venturing into the application of Two-Way MANOVA, it’s vital to establish and acknowledge the assumptions that underpin the reliability of this statistical method. Adhering to these assumptions is crucial for accurate and valid results. The key assumptions of Two-Way MANOVA include:
- Multivariate Normality: The dependent variables should collectively exhibit a multivariate normal distribution. This ensures that the statistical inferences drawn from Two-Way MANOVA are robust and accurate.
- Homogeneity of Covariance Matrices: The covariance matrices of the dependent variables across different groups formed by the combination of the two independent variables should be roughly equal. This assumption, known as homogeneity of variance-covariance, is vital for the reliability of the test.
- Independence of Observations: Observations within and across groups should be independent. The independence assumption ensures that the results are not unduly influenced by interdependencies among observations.
- Linearity: The relationships between the independent variables and each dependent variable should be linear. Linearity is essential for accurate interpretation and meaningful analysis.
Acknowledging and validating these assumptions before conducting Two-Way MANOVA enhances the credibility and robustness of the results, laying the groundwork for a more insightful analysis.
The Hypothesis of the Two-Way MANOVA Test
Formulating clear and concise hypotheses is a pivotal step in the Two-Way MANOVA analysis. The hypotheses for Two-Way MANOVA encompass the main effects of each independent variable and their interaction. Specifically:
First Main Effect
- Null Hypothesis: There is no significant difference in the mean vectors of the dependent variables across the levels of the first independent variable.
- Alternative Hypothesis: There is a significant difference in the mean vectors of the dependent variables across the levels of the first independent variable.
Second Main Effect
- Null Hypothesis: There is no significant difference in the mean vectors of the dependent variables across the levels of the second independent variable.
- Alternative Hypothesis: There is a significant difference in the mean vectors of the dependent variables across the levels of the second independent variable.
Interaction Effect
- Null Hypothesis: There is no significant interaction between the first and second independent variables in influencing the mean vectors of the dependent variables.
- Alternative Hypothesis: There is a significant interaction between the first and second independent variables in influencing the mean vectors of the dependent variables.
These hypotheses guide the statistical testing process, allowing researchers to discern the specific effects and interactions between the independent variables on the multivariate pattern of the dependent variables. In the subsequent sections, we will explore a practical example of Two-Way MANOVA and provide a step-by-step guide on how to perform and interpret the analysis in SPSS.
Example of Two-Way MANOVA
Consider a scenario where researchers are investigating the impact of two factors, A and B, on students’ performance in multiple subjects. Factor A represents different teaching methods (e.g., lectures, workshops), and Factor B represents different time durations (e.g., short duration, long duration). The dependent variables are the scores obtained by students in subjects such as Maths, and Chemistry.
The Two-Way MANOVA allows researchers to simultaneously assess the main effects of teaching methods and time durations on the multivariate pattern of scores across subjects. Additionally, it facilitates the exploration of whether there is an interaction effect, indicating whether the combined influence of teaching methods and time durations differs from what would be expected based on the individual effects.


Step by Step: Running Two Way MANOVA Test in SPSS Statistics
Now, let’s delve into the step-by-step process of conducting the Two-Way MANOVA Test using SPSS. Here’s a step-by-step guide on how to perform a Two-Way Multivariate Analysis of Variance (MANOVA) in SPSS:
- STEP: Load Data into SPSS
Commence by launching SPSS and loading your dataset, which should encompass the variables of interest – a categorical independent variable. If your data is not already in SPSS format, you can import it by navigating to File > Open > Data and selecting your data file.
- STEP: Access the Analyze Menu
In the top menu, locate and click on “Analyze.” Within the “Analyze” menu, navigate to “General Linear Model” and choose ” Multivariate” Analyze > General Linear Model> Multivariate
- STEP: Specify Variables
In the dialogue box, move the dependent variables to the “Dependent Variable” field. Move the variable representing the group or factors to the “Fixed Factor (s)” field. This is the independent variable with different levels or groups.
- STEP: Post-Hoc and Plots
Click on the “Plot” button, Move to Factor into the Horizontal Axis and Second factor into Separate Lines , and then click the “Add” button.
- STEP: Options
Snap on the “Options” button Check “Descriptive”, “Homogeneity Test” and “Estimates of effect size”
- STEP: Generate SPSS Output
Once you have specified your variables and chosen options, click the “OK” button to perform the analysis. SPSS will generate a comprehensive output, including the requested frequency table and chart for your dataset.
Executing these steps in SPSS enables the analysis of the impact of the independent variable on the multivariate pattern of dependent variables. Now, let’s move on to the crucial step of interpreting the SPSS output for Two-Way MANOVA.
Note
Conducting a Two-Way ANOVA test in SPSS provides a robust foundation for understanding the key features of your data. Always ensure that you consult the documentation corresponding to your SPSS version, as steps might slightly differ based on the software version in use. This guide is tailored for SPSS version 25, and for any variations, it’s recommended to refer to the software’s documentation for accurate and updated instructions.
SPSS Output for Multivariate Analysis of Variance


How to Interpret SPSS Output of Two-Way MANOVA Test
When interpreting the SPSS output of Two-Way MANOVA, focus on key elements that provide insights into the impact of the independent variable on the set of dependent variables:
Descriptives Table
- Mean and Standard Deviation: Evaluate the means and standard deviations of each group. This provides an initial overview of the central tendency and variability within each group.
- Sample Size (N): Confirm the number of observations in each group. Discrepancies in sample sizes could impact the interpretation.
- 95% Confidence Interval (CI): Review the confidence interval for the mean difference.
Box’s M Test
- Box’s M test for homogeneity of covariance matrices: A significant result may indicate a violation of the assumption of homogeneity of variances.
Multivariate Tests Table
Multivariate Tests table for additional statistical information, including Wilks’ Lambda Test, Pillai’s Trace, Hotelling’s Trace, and Roy’s Largest Root. These tests contribute to the overall assessment of the impact of the independent variable.
- Wilks’ Lambda test: A significant result indicates that there are significant differences in the multivariate pattern of the dependent variables across the levels of the independent variable.
Test of Homogeneity of Variances Table
- Levene’s Test: In the Test of Homogeneity of Variances table, look at Levene’s Test statistic and associated p-value. This test assesses whether the variances across groups are roughly equal. A non-significant p-value suggests that the assumption of homogeneity of variances is met.
Tests of Between-Subjects Effects
- Between-Groups: Move on to the ANOVA table, which displays the Between-Groups, degrees of freedom, mean squares, the F-ratio, and the p-value.
- F-Ratio: Focus on the F-ratio. A higher F-ratio indicates larger differences among group means relative to within-group variability.
- Degrees of Freedom: Note the degrees of freedom for Between-Groups. These values are essential for calculating the critical F-value.
- P-Value: Examine the p-value associated with the F-ratio. If the p-value is below your chosen significance level (commonly 0.05), it suggests that at least one group’s mean is significantly different.
- Eta-squared: If available, consider effect size measures in the ANOVA table. Eta-squared indicates the proportion of variance in the dependent variable explained by the group differences.
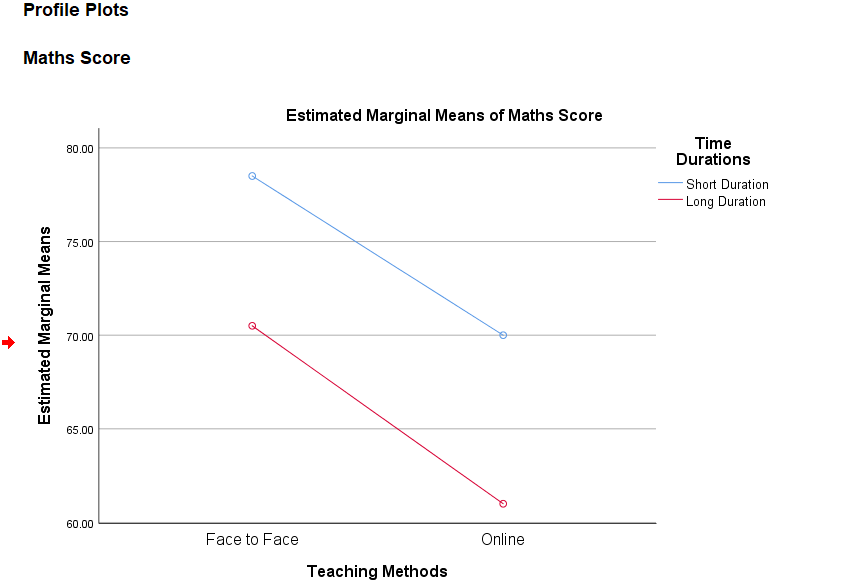
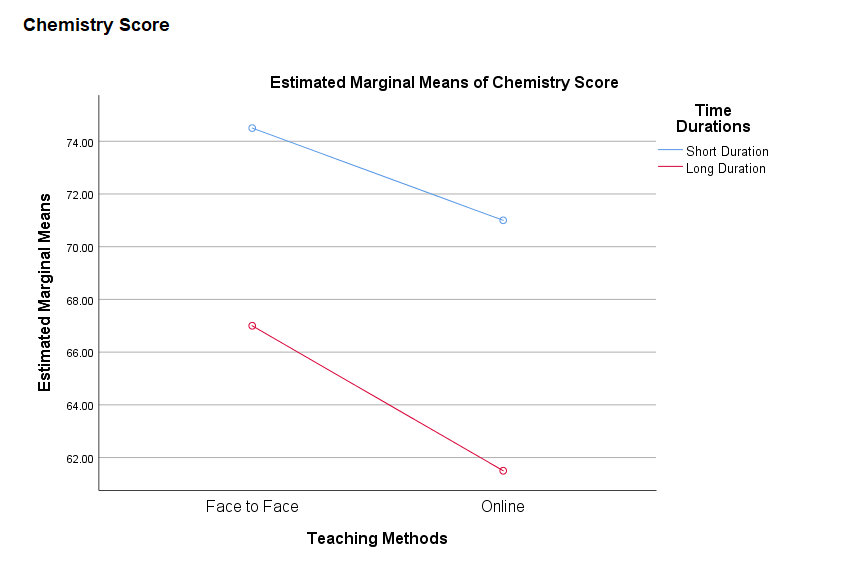
Line Plots
- Interaction Effect: Focus on any interaction effects reported in the output with line plots. An interaction effect suggests that the combined influence of the independent variables differs from what would be expected based on their individual effects.
Post Hoc Tests Table (If Applied):
- Specific Group Differences: If you conducted post-hoc tests, examine the results. Look for significant differences between specific pairs of groups. Pay attention to p-values and confidence intervals to identify which groups are significantly different from each other.
By systematically analyzing these components, you gain a comprehensive understanding of whether there are significant differences in the multivariate pattern of dependent variables across the levels of the independent variable. In the following section, we’ll guide you on how to report the results of Two-Way MANOVA in APA style, ensuring clarity and adherence to academic standards.
How to Report Results of Two-Way MANOVA Test in APA
Crafting a succinct and structured report in APA style is crucial for communicating your Two-Way MANOVA results effectively. Follow these steps for a well-organized report:
- Introduction: Provide a brief introduction, outlining the purpose of the analysis and specifying the independent variables and dependent variables under investigation.
- Analysis Conducted: Clearly state that a Two-Way MANOVA was conducted to examine the main effects and interaction effects of [Factor A] and [Factor B] on the multivariate pattern of [Dependent Variables].
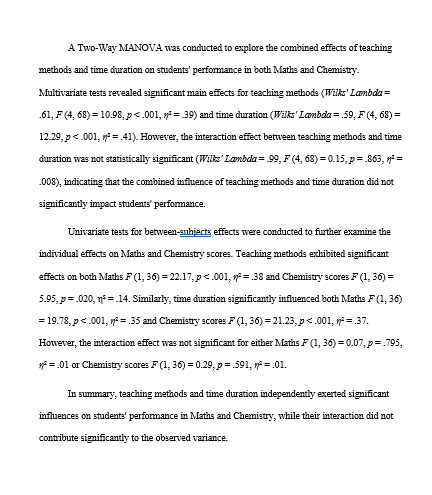
- Results Summary: Present a summary of the results, including the significance levels of Wilks’ Lambda test and any reported interaction effects. For example, “The analysis revealed a significant effect of [Factor A] on the multivariate pattern of [Dependent Variables] (Wilks’ Lambda = [value], F(df1, df2) = [F-ratio], p = [p-value]). Additionally, there was a significant interaction between [Factor A] and [Factor B] (Wilks’ Lambda = [value], F(df1, df2) = [F-ratio], p = [p-value]).”
- Post-Hoc Tests (If applied): If post-hoc tests were conducted, report significant differences between specific groups. For instance, “Post-hoc tests using [Post-Hoc Test] indicated a significant difference between [specific groups] (p < 0.05).”
- Effect Size Measures (Optional): Include effect size measures (e.g., partial eta-squared) to provide insights into the practical significance of the findings.
Conclude with a discussion of the implications of your results and any limitations of the study. Suggest avenues for future research to enrich the understanding of the complex relationships between the independent variables and the multivariate pattern of dependent variables.
Get Help For Your SPSS Analysis
Embark on a seamless research journey with SPSSAnalysis.com, where our dedicated team provides expert data analysis assistance for students, academicians, and individuals. We ensure your research is elevated with precision. Explore our pages;
- SPSS Data Analysis Help – SPSS Helper,
- Quantitative Analysis Help,
- Qualitative Analysis Help,
- SPSS Dissertation Analysis Help,
- Dissertation Statistics Help,
- Statistical Analysis Help,
- Medical Data Analysis Help.
Connect with us at SPSSAnalysis.com to empower your research endeavors and achieve impactful results. Get a Free Quote Today!