Independent Samples T Test in SPSS
Discover Independent Samples T Test in SPSS! Learn how to perform, understand SPSS output, and report results in APA style. Check out this simple, easy-to-follow guide below for a quick read!
Struggling with the Independent Samples t-test in SPSS? We’re here to help. We offer comprehensive assistance to students, covering assignments, dissertations, research, and more. Request Quote Now!

Introduction
Welcome to our comprehensive guide on conducting an Independent Samples T Test in SPSS. If you’re delving into the world of statistics, particularly hypothesis testing, you’ll likely encounter situations where you need to compare the means of two groups. The Independent Samples T Test is a powerful tool for precisely that. Whether you’re a student working on a research project or a professional researcher aiming to draw meaningful conclusions, understanding the ins and outs of this statistical test is paramount. In this post, we’ll take you through the basics, from defining what the Independent Samples T Test is to providing a step-by-step guide on how to perform it using SPSS. By the end, you’ll not only have a solid grasp of the theory but also the practical skills to apply this statistical technique to your data.
What is the Independent Samples T Test?
Firstly, let’s demystify the Independent Samples T Test. This statistical method is employed when you want to compare the means of two independent groups to determine if there is a statistically significant difference between them. “Independent” here means that the two groups being compared are separate entities and the individuals in one group are not related to the individuals in the other. The test helps researchers ascertain whether the observed differences in means are likely due to actual differences in the populations from which the samples are drawn or if they could be attributed to chance. This can be a crucial analysis, for example, when comparing the effectiveness of two different teaching methods or evaluating the impact of a treatment on distinct groups. Now, let’s delve deeper into the assumptions of the Independent Samples T Test.
Assumptions of Independent Samples T Test
Before delving into the hypothesis and practical application of the Independent Samples T Test, it’s crucial to understand its underlying assumptions.
- Normality: The data within each group should follow an approximately normal distribution. This assumption becomes more critical with smaller sample sizes.
- Equal Variances: The variances of the two groups being compared should be approximately equal. This assumption is important for accurate interpretation, although the test is somewhat robust to violations, especially with larger sample sizes.
- Independence: The observations within each group must be independent of each other. In other words, the value of one observation should not be influenced by or related to the value of any other observation.
Adhering to these assumptions enhances the reliability and validity of the Independent Samples T Test results, providing a solid foundation for accurate statistical analysis.
The hypothesis of Independent Samples T Test
Now, let’s unravel the formulation of hypotheses in the Independent Samples T Test.
- The null hypothesis (H0): There is no significant difference between the means of the two independent groups in the population.
- The alternative hypothesis (H1): There is a significant difference between the means of the two independent groups in the population.
Crafting precise and clear hypotheses is crucial for subsequent statistical analysis and interpretation.
Example of Independent Samples T Test
To illustrate the practical application of the Independent Samples T Test, let’s consider a hypothetical scenario. Imagine you are a researcher investigating the effectiveness of two different training programs in improving employees’ job performance. You collect performance scores from employees who underwent each training program and aim to determine if there’s a significant difference in the mean performance scores between the two groups.
- The null hypothesis: There is no significant difference in the mean performance scores between the two groups.
- The alternative hypothesis: There is a significant difference in the mean performance scores between the two groups.
By conducting the Independent Samples T Test, you can statistically evaluate whether the observed differences are likely due to the training programs’ effectiveness or if they could be attributed to random chance.
In the subsequent sections, we’ll guide you through the step-by-step process of performing and interpreting the Independent Samples T Test using SPSS, equipping you with practical skills for your research endeavors.
Step by Step: Running Independent Samples T Test in SPSS Statistics
Let’s embark on a step-by-step guide on performing the Independent Samples T Test using SPSS
- STEP: Load Data into SPSS
Commence by launching SPSS and loading your dataset, which should encompass the variables of interest – a categorical independent variable. If your data is not already in SPSS format, you can import it by navigating to File > Open > Data and selecting your data file.
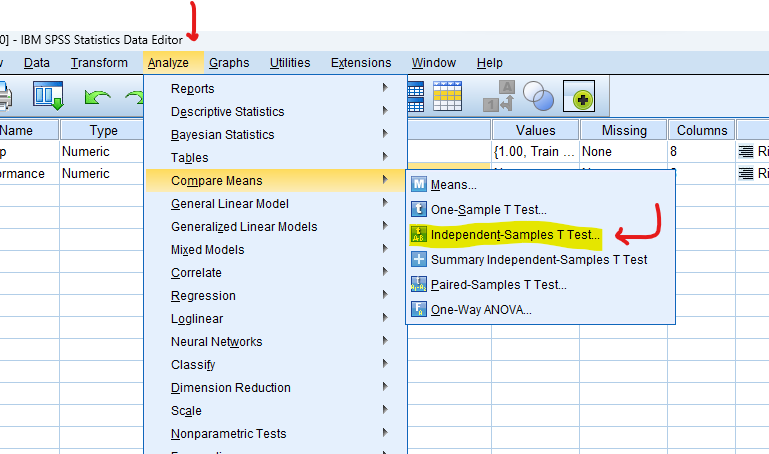
- STEP: Access the Analyze Menu
In the top menu, locate and click on “Analyze.” Within the “Analyze” menu, navigate to “Compare Means” and choose ” Independent-Samples T Test.” Analyze > Compare Means> Independent-Samples T Test
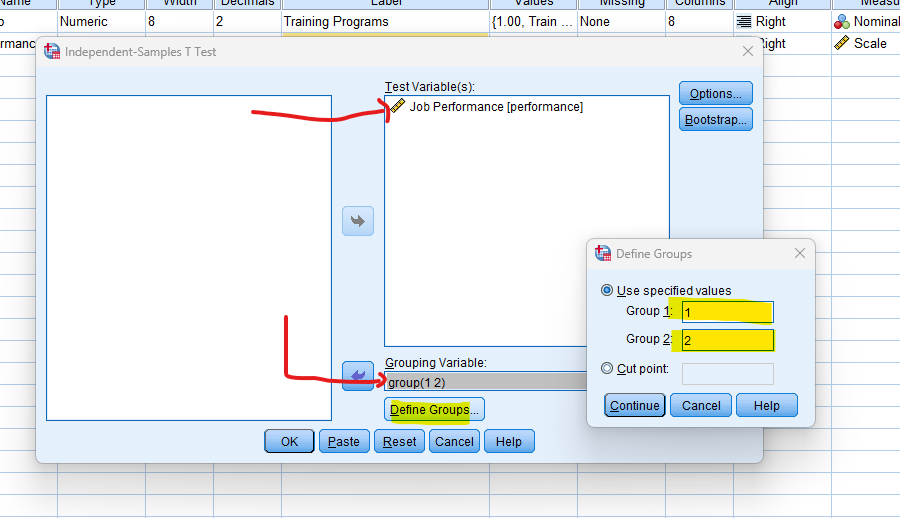
- STEP: Specify Variables
In the dialogue box, select the variable representing the dependent variable into “Test Variables” and the grouping variable, click “Define Groups” and enter the values that represent the groups in your grouping variable.
- STEP: Generate SPSS Output
Once you have specified your variables and chosen options, click the “OK” button to perform the analysis. SPSS will generate a comprehensive output, including the requested frequency table and chart for your dataset.
Note: Conducting an Independent t-test in SPSS provides a robust foundation for understanding the key features of your data. Always ensure that you consult the documentation corresponding to your SPSS version, as steps might slightly differ based on the software version in use. This guide is tailored for SPSS version 25, and any variations, it’s recommended to refer to the software’s documentation for accurate and updated instructions.

How to Interpret SPSS Output of Independent Samples T Test
SPSS will generate output, including descriptive statistics, the t-test value, degrees of freedom, and the p-value.
Descriptive Statistics Table
- Mean and Standard Deviation: Evaluate the means and standard deviations of each group. This provides an initial overview of the central tendency and variability within each group.
- Sample Size (N): Confirm the number of observations in each group. Discrepancies in sample sizes could impact the interpretation.
- Standard Error of the Mean (SE): Assess the precision of the sample mean estimates.
Independent Samples T-Test Table:
- Levene’s Test for Equality of Variances: Examine the Levene statistic and associated p-value. A non-significant p-value suggests equal variances between groups, supporting the assumption.
- t-Test Value: Evaluate the t-statistic, which measures the difference between the group means. A higher absolute t-value indicates a more significant difference.
- Degrees of Freedom (df): Note the degrees of freedom associated with the t-test. This value is crucial for determining the critical t-value.
- p-Value: Assess the p-value to determine the statistical significance of the observed difference. A p-value less than the chosen significance level (e.g., 0.05) indicates a significant result.
- Mean Difference: Understand the actual difference between the group means. Positive or negative values indicate the direction of the difference.
- 95% Confidence Interval (CI): Review the confidence interval for the mean difference. If it does not include zero, it supports the rejection of the null hypothesis.
- Effect Size (Cohen’s d or Hedges’ g): Consider the effect size as it provides insights into the practical significance of the observed difference. (available SPSS V 28)
Interpret the results by comparing the p-value to your chosen significance level (commonly set at 0.05). If the p-value is less than or equal to 0.05, you can reject the null hypothesis, indicating a statistically significant difference.
In the subsequent section, we’ll guide you on how to effectively report these findings following the guidelines of the American Psychological Association (APA).
How to Report Results of Independent Samples T-Test in APA
Reporting the results of an Independent Samples T Test in APA style ensures clarity and adherence to established guidelines. Begin with a concise description of the analysis conducted, including the test name, the variables under investigation, and the groups compared.
For instance, “An Independent Samples T Test was conducted to examine the difference in mean performance scores between employees who underwent different training programs.”
Present the key statistical findings, including the t-test value, degrees of freedom, and p-value. For example, “The results revealed a significant difference in performance scores between the two training groups, t(df) = [t-test value], p = [p-value].”
Provide additional information such as effect size (e.g., Cohen’s d) and a confidence interval for the mean difference to offer a comprehensive overview of the results.
Conclude the report by summarizing the implications of the findings in relation to your research question or hypothesis. This structured approach to reporting Independent Samples T Test results in APA format ensures transparency and facilitates the understanding of your research outcomes.

Get Help For Your SPSS Analysis
Embark on a seamless research journey with SPSSAnalysis.com, where our dedicated team provides expert data analysis assistance for students, academicians, and individuals. We ensure your research is elevated with precision. Explore our pages;
- SPSS Data Analysis Help – SPSS Helper,
- Quantitative Analysis Help,
- Qualitative Analysis Help,
- SPSS Dissertation Analysis Help,
- Dissertation Statistics Help,
- Statistical Analysis Help,
- Medical Data Analysis Help.
Connect with us at SPSSAnalysis.com to empower your research endeavors and achieve impactful results. Get a Free Quote Today!