Frequency Analysis in SPSS
Discover Frequency Analysis in SPSS! Learn how to perform, understand SPSS output, and report results in APA style. Check out this simple, easy-to-follow guide below for a quick read!
Struggling with Frequency Analysis & Table in SPSS? We’re here to help. We offer comprehensive assistance to students, covering assignments, dissertations, research, and more. Request Quote Now!

Introduction
Welcome to our comprehensive guide on Frequency Analysis in SPSS. Understanding the nuances of Frequency Analysis is crucial for anyone delving into statistical analysis using SPSS software. This post aims to demystify the process, guiding you through the fundamental concepts, steps, and interpretation of results related to Frequency Analysis. Whether you’re a student navigating a research assignment – dissertation or a professional seeking to enhance your analytical skills, this guide is tailored to simplify the intricate world of Frequency Analysis.
What is Frequency Table and Frequency Distribution?
To embark on a journey of Frequency Analysis, it’s essential to grasp the core concepts of Frequency Tables and Frequency Distributions.
- A Frequency Table is a statistical tool that organizes data into categories and displays the number of occurrences or frequencies within each category.
- Meanwhile, a Frequency Distribution provides a comprehensive overview, systematically presenting data to highlight patterns and variations.
These tools serve as the foundation for more advanced statistical analyses, making them indispensable in exploring and summarising datasets. By the end of this section, you’ll have a solid understanding of how Frequency Tables and Distributions set the stage for insightful Frequency Analysis.
Frequency Analysis
Frequency Analysis, a cornerstone of statistical exploration, involves the examination of the distribution of values within a dataset. It goes beyond mere enumeration, offering insights into the patterns, tendencies, and variations inherent in the data. By conducting Frequency Analysis, researchers can identify the most common values, outliers, and trends, facilitating informed decision-making. This analytical method serves as a powerful tool for researchers across diverse fields, aiding in the extraction of meaningful information from raw data. In the subsequent sections, we will delve into the intricacies of Frequency Analysis, breaking down its components and elucidating the step-by-step process using SPSS.
Aim of Frequency Analysis
At its core, Frequency Analysis aims to unravel the story hidden within the data. By scrutinizing the distribution of values, one can discern patterns, irregularities, and central tendencies that are pivotal in drawing meaningful conclusions. The ultimate goal is to provide a comprehensive and quantitative description of the dataset, enabling researchers to make data-driven decisions. Whether you are investigating survey responses, examining exam scores, or analysing any other dataset, Frequency Analysis equips you with the tools to understand the underlying structures and characteristics. In the subsequent sections, we will explore the assumptions that underpin Frequency Analysis, ensuring a robust foundation for accurate interpretation and reporting.
Assumptions for Frequency Analysis
Before delving into the practicalities of Frequency Analysis, it’s imperative to acknowledge the underlying assumptions that guide this statistical method.
- Categorical: the data should be categorical, consisting of distinct categories or groups.
- Grouping: each observation must fall into one and only one category, ensuring the integrity of the analysis.
- Independent: the data should be independent, meaning the occurrence of an event in one category does not influence the occurrence in another.
Understanding and respecting these assumptions are paramount for conducting accurate Frequency Analysis. With these in mind, let’s proceed to an illustrative example that will elucidate the application of Frequency Analysis in real-world scenarios.
Example for Frequency Analysis
Let’s delve into how Frequency Analysis, when applied solely to demographic characteristics, can illuminate valuable patterns within survey data. Picture a scenario where we are examining a dataset that includes demographic variables such as age, gender, education, and marital status. By conducting Frequency Analysis exclusively on these demographic factors, we gain crucial insights into the composition of our sample.
In addition, to grasp the practical application of Frequency Analysis, let’s consider a hypothetical scenario where we are analysing the frequency of responses to a customer satisfaction survey. The data comprises categories representing different levels of satisfaction (Likert Scale) – ‘Very Satisfied,’ ‘Satisfied,’ ‘Neutral,’ ‘Dissatisfied,’ and ‘Very Dissatisfied.’ Through Frequency Analysis, we can uncover the distribution of responses, identify which satisfaction level prevails, and understand the overall sentiment of the surveyed population. This example serves as a practical bridge between theory and application, illustrating how Frequency Analysis can be a powerful tool for gaining insights from diverse datasets.

Step by Step: Running Frequency Analysis in SPSS Statistics
Performing Frequency Analysis in SPSS involves several steps. Here’s a step-by-step guide to assist you through the procedure:
- STEP: Load Data into SPSS
Commence by launching SPSS and loading your dataset, which should encompass the variables of interest – a categorical independent variable. If your data is not already in SPSS format, you can import it by navigating to File > Open > Data and selecting your data file.
- STEP: Access the Analyze Menu
In the top menu, locate and click on “Analyze.” Within the “Analyze” menu, navigate to “Descriptive Statistics” and choose ” Frequencies.” Analyze > Descriptive Statistics > Frequencies
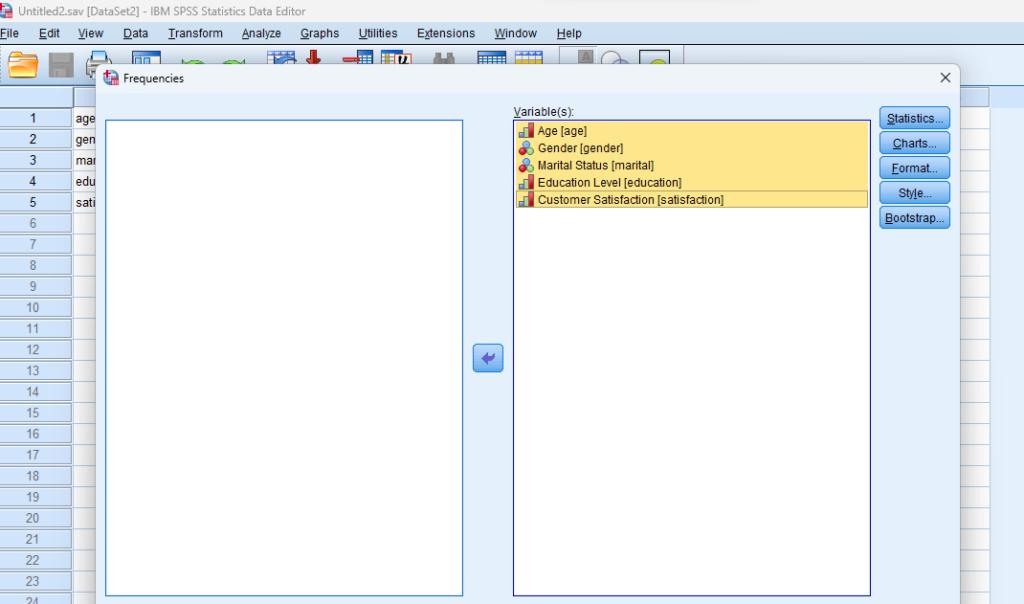
- STEP: Specify Variables
Upon selecting “ Frequencies” a dialog box will appear. Choose the variable of interest and move it to the ‘Variable(s)’ box
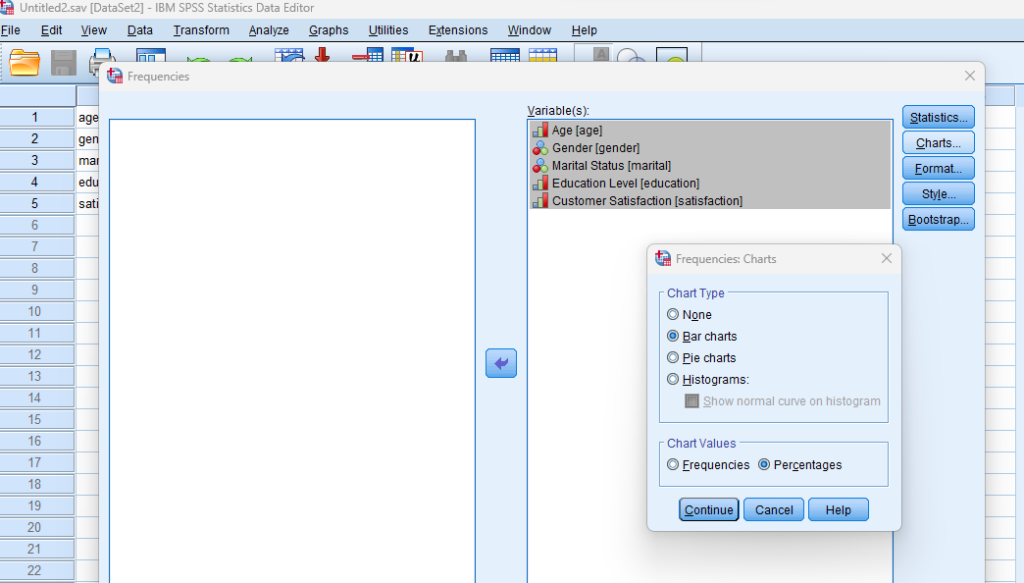
- STEP: Define Chart
Click on the ‘Charts’ button to include visual representations, such as bar charts, alongside the frequency tables. This step adds a visual dimension to your analysis, making it more accessible.
- STEP: Generate Frequency Table and Chart:
Once you have specified your variables and chosen options, click the “OK” button to perform the analysis. SPSS will generate a comprehensive output, including the requested frequency table and chart for your dataset.
Conducting frequency analysis in SPSS provides a robust foundation for understanding the key features of your data. Always ensure that you consult the documentation corresponding to your SPSS version, as steps might slightly differ based on the software version in use. This guide is tailored for SPSS version 25, and any variations, it’s recommended to refer to the software’s documentation for accurate and updated instructions.


How to Interpret SPSS Output of Frequency Analysis
Upon generating the Frequency Table in SPSS, understanding the results of output is pivotal for drawing meaningful insights. Here’s a general guide on interpreting the output of the Frequency Table in SPSS:
Frequency
– Definition: The Frequency column displays the number of cases or occurrences for each category or value in your dataset.
– Interpretation: Higher frequencies indicate a greater prevalence of a particular category, while lower frequencies suggest less common occurrences.
Percent
– Definition: The Percent column shows the proportion of each category’s frequency relative to the total number of cases, expressed as a percentage.
– Interpretation: This column provides a relative measure of the distribution, helping you understand the contribution of each category to the overall dataset.
Valid Percent
– Definition: Valid Percent represents the percentage of cases for each category relative to the total valid cases, excluding any missing or undefined data.
– Interpretation: It accounts for the completeness of your dataset, giving you a percentage based on the valid responses. This is particularly useful when dealing with datasets with missing values.
Cumulative Percent:
– Definition: Cumulative Percent shows the accumulated percentage up to each category, progressing through the list of categories.
– Interpretation: This column helps you understand the cumulative impact of each category on the overall distribution. It is useful for identifying the point at which a certain percentage of the total is reached.
In summary, Frequency provides the raw count of occurrences, Percent offers a relative measure in percentage terms, Valid Percent considers completeness by excluding missing data, and Cumulative Percent shows the accumulating contribution of each category. Understanding these columns collectively allows for a comprehensive interpretation of the distribution patterns within your dataset.
Example: SPSS Statistics for Frequency Analysis
In our example, SPSS Output for Frequency Analysis, the Frequency Tables provided describe four variables: Gender, Age, Marital Status, and education level, based on a sample of 32 individuals. Here’s an interpretation of age statistics:
- Age: The age distribution shows that the majority of respondents fall within the ’33-40′ age range, constituting 46.9% of the sample. The second-largest group is ’26-33′ at 31.3%, and the smallest group is ’18-25′ at 21.9%. This indicates a relatively diverse but slightly skewed age distribution towards the ’33-40′ category.
- Gender: The gender distribution reveals that the majority of respondents are female, constituting 71.9% of the sample. Males make up the remaining 28.1%. This suggests a significant gender imbalance in the surveyed population, with a higher representation of females.
- Marital Status: Examining marital status, the most prevalent category is ‘Single (never married)’ at 40.6%, followed by ‘Separated’ at 18.8%. The cumulative percentage indicates that a significant portion of respondents is either single or separated, making up 65.6% of the sample.
- Education Level: The education distribution illustrates diversity, with ‘Bachelor’s degree’ being the most common category at 28.1%. ‘High school degree or equivalent’ follows at 21.9%. This suggests a varied educational background among respondents, with a higher representation of those with at least a bachelor’s degree.
How to Report Results of Frequency Analysis in APA
Effectively communicating the results of Frequency Analysis is integral to the research process. By APA guidelines, begin by providing a concise summary of the key findings, highlighting central tendencies and notable patterns. Subsequently, present the detailed Frequency Table in the appendix, referring to it in the main text. Ensure clarity and precision in your reporting, allowing readers to comprehend the significance of the Frequency Analysis in the broader context of your research. By following these guidelines, you not only adhere to academic standards but also contribute to the transparency and reproducibility of your research findings.

Lastly, Embark on a seamless research journey with SPSSAnalysis.com, where our dedicated team provides expert data analysis assistance for students, academicians, and individuals. We ensure your research is elevated with precision. Explore our pages;
- SPSS Data Analysis Help – SPSS Helper,
- Quantitative Analysis Help,
- Qualitative Analysis Help,
- SPSS Dissertation Analysis Help,
- Dissertation Statistics Help,
- Statistical Analysis Help,
- Medical Data Analysis Help.
Connect with us at SPSSAnalysis.com to empower your research endeavors and achieve impactful results. Get a Free Quote Today!