Descriptive Statististics in SPSS
Discover Descriptive Statistics in SPSS! Learn how to perform, understand SPSS output, and report results in APA style. Check out this simple, easy-to-follow guide below for a quick read!
Struggling with Descriptive Statistics in SPSS? We’re here to help. We offer comprehensive assistance to students, covering assignments, dissertations, research, and more. Request Quote Now!

Introduction
Welcome to our exploration of Descriptive Statistics in SPSS! In the realm of statistical analysis, understanding the basics is paramount, and that’s precisely what descriptive statistics offer. These analytical tools provide a comprehensive overview of data, aiding researchers and analysts in drawing meaningful insights. This blog post will unravel the intricacies of descriptive statistics, focusing specifically on its application within the Statistical Package for the Social Sciences (SPSS). Whether you’re a seasoned researcher or someone just starting their statistical journey, this guide will equip you with the knowledge needed to navigate and leverage descriptive statistics effectively.
Descriptive Statistics
Descriptive statistics serves as the bedrock of statistical analysis, acting as a means to summarise, organize, and present raw data in a meaningful and interpretable manner. Unlike inferential statistics which conclude populations based on sample data, descriptive statistics concentrate on the characteristics of the data itself. It involves measures of central tendency such as mean, median, and mode, as well as measures of variability like range and standard deviation. Essentially, descriptive statistics provide a snapshot of the essential features of a dataset, enabling researchers to identify patterns, trends, and outliers. This fundamental understanding serves as the cornerstone for more advanced statistical analyses, making it an indispensable tool in the researcher’s toolkit.
The Aim of Descriptive Statistics
The primary aim of descriptive statistics is to distill complex datasets into manageable and insightful information. By offering a snapshot of key characteristics, it facilitates a clearer comprehension of the underlying patterns within the data. Researchers employ descriptive statistics to summarise large datasets succinctly, enabling them to communicate essential features to both technical and non-technical audiences. These statistical measures serve as a foundation for making informed decisions, guiding subsequent analyses, and, ultimately, extracting meaningful conclusions from the data at hand.
Assumptions for Descriptive Statistics
Before delving into the intricacies of descriptive statistics, it’s crucial to acknowledge the underlying assumptions.
- Numerical: Descriptive statistics assume that the data under examination is numerical, as these measures primarily deal with quantitative information.
- Random: These statistics operate under the assumption of a random and representative sample, ensuring that the calculated values accurately reflect the broader population.
Understanding these assumptions is pivotal for accurate interpretation and application, reinforcing the importance of meticulous data collection and the consideration of the statistical context in which descriptive statistics are employed.


Step by Step: Running Descriptive Statistics in SPSS Statistics
Performing Descriptive Statistics in SPSS involves several steps. Here’s a step-by-step guide to assist you through the procedure:
1. STEP: Load Data into SPSS
Commence by launching SPSS and loading your dataset, which should encompass the variables of interest – a categorical independent variable (if any) and the continuous dependent variable. If your data is not already in SPSS format, you can import it by navigating to File > Open > Data and selecting your data file.
2. STEP: Access the Analyze Menu
In the top menu, locate and click on “Analyze.” Within the “Analyze” menu, navigate to “Descriptive Statistics” and choose “Descriptives.” Analyze > Descriptive Statistics > Descriptives
3. STEP: Specify Variables
Upon selecting “Descriptives,” a dialog box will appear. Transfer the continuous variable you wish to analyse into the “Variable(s)” box.
4. STEP: Define Options
Click on the “Options” button within the “Descriptives” dialog box to access additional settings. Here, you can request various descriptive statistics such as mean, median, mode, standard deviation, and more. Adjust the settings according to your analytical requirements.
5. STEP: Generate Descriptive Statistics:
Once you have specified your variables and chosen options, click the “OK” button to execute the analysis. SPSS will generate a comprehensive output, including the requested descriptive statistics for your dataset.
Conducting descriptive statistics in SPSS provides a robust foundation for understanding the key features of your data. Always ensure that you consult the documentation corresponding to your SPSS version, as steps might slightly differ based on the software version in use. This guide is tailored for SPSS version 25, and for any variations, it’s recommended to refer to the software’s documentation for accurate and updated instructions.
How to Interpret SPSS Output of Descriptive Statistics
Interpreting the SPSS output for descriptive statistics is pivotal for drawing meaningful conclusions. Firstly, focus on the measures of central tendency, such as the mean, median, and mode. These values provide insights into the typical or average score in your dataset. Next, examine measures of variability, including the range and standard deviation. The range indicates the spread of scores from the lowest to the highest, while the standard deviation quantifies the average amount of variation in your data.
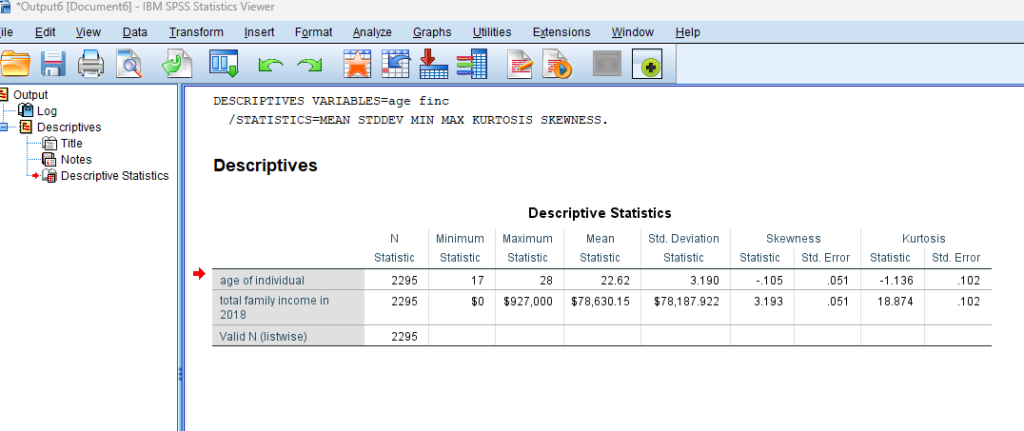
SPSS Statistics for Descriptive
In our example, SPSS Output for Descriptive Statistics, the descriptive statistics provided describe two variables: “age of individual” and “total family income in 2018” based on a sample of 2295 individuals. Here’s an interpretation of age statistic:
Age of Individual:
- Mean: The average age of the individuals in the sample is approximately 22.62 years.
- Standard Deviation: The standard deviation of the ages is 3.190, indicating the extent of variability or dispersion around the mean.
- Skewness: The skewness is approximately -0.105. A negative skewness suggests that the distribution of ages is slightly skewed to the left, meaning there may be a longer tail on the left side of the distribution.
- Kurtosis: The kurtosis is -1.136. A negative kurtosis indicates that the distribution has lighter tails and is slightly less peaked than a normal distribution.
These descriptive statistics provide a summary of the central tendency, variability, skewness, and kurtosis for both the ages in the dataset.
How to Report Results of Descriptive Statistics in APA
Accurate reporting of descriptive statistics is crucial, especially when adhering to the guidelines of the American Psychological Association (APA). When presenting results, start with a brief description of the sample, including the total number of participants and any relevant demographics. Subsequently, report the key descriptive statistics, such as means and standard deviations, in a concise and organised manner. Ensure clarity by using appropriate tables and figures, and be mindful of APA formatting rules for statistical notation. Importantly, supplement your numerical results with brief interpretations, highlighting significant findings and their implications. By following APA guidelines, your reporting becomes not just a presentation of numbers but a narrative that communicates the story embedded within your data.
Example of Descriptive Statistics Results in APA Style

Embark on a seamless research journey with SPSSAnalysis.com, where our dedicated team provides expert data analysis assistance for students, academicians, and individuals. We ensure your research is elevated with precision. Explore our pages;
- SPSS Data Analysis Help – SPSS Helper,
- Quantitative Analysis Help,
- Qualitative Analysis Help,
- SPSS Dissertation Analysis Help,
- Dissertation Statistics Help,
- Statistical Analysis Help,
- Medical Data Analysis Help.
Connect with us at SPSSAnalysis.com to empower your research endeavors and achieve impactful results. Get a Free Quote Today!