Data Analysis Using SPSS
Data Analysis Using SPSS: Elevate Your Research with Our Customized Data Analysis, Methodology, and Results Writing Services. Specializing in SPSS, R, STATA, JASP, Nvivo, and More for Comprehensive Assistance.
Top-Tier Statisticians 👩🔬 | Free Unlimited Revisions 🔄 | NDA-Protected Service 🛡️ | Plagiarism-Free Work 🎓 | On-Time Delivery 🎯 | 24/7 Support 🕒 | Strict Privacy Assured 🔒 | Satisfaction with Every Data Analysis ✅
Our Expertise Recognized by Students at Leading Universities:


Data Analysis Using SPSS
Statistical data analysis and writing assistance is a comprehensive service tailored to meet the specific needs of your academic research, ensuring that you receive expert support in the following key areas:
- Methodology Writing: We develop a detailed plan for your research approach, outlining the statistical methods to be used in your study. This foundational step ensures that your research is built on a robust methodological framework.
- Data Management: Our services include importing your data into the preferred statistical software, recoding variables to suit analysis requirements, and data cleaning to ensure accuracy and reliability. This process prepares your data for meaningful analysis, setting the stage for insightful findings.
- Data Analysis & Hypothesis Testing: Whether your research requires quantitative data analysis, qualitative data analysis, or a mixed design, our experts are equipped to handle it. We apply appropriate statistical tests for your hypothesis and techniques to analyse your data, uncovering the patterns and insights that support your research objectives.
- Results Writing: We present your findings in a clear and academically rigorous format, adhering to APA, AMA, Harvard, or other academic styles as required. This includes preparing tables and graphs that effectively communicate your results, making them accessible to your intended audience.
Hire a trusted statistician today, and publish with total confidence — Get a Free Quote Now!
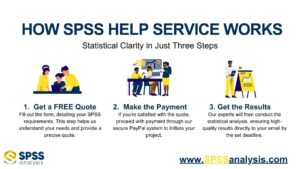
How Statistics Support Service Works
Data Analysis Using SPSS: Your Complete Guide to Confident Statistical Results
SPSS — short for Statistical Package for the Social Sciences — has long been the go-to software for researchers, students, and professionals needing reliable, user-friendly data analysis. From social science surveys to clinical trials and business reports, millions trust SPSS to turn raw data into credible insights.
Yet for many, actually doing data analysis using SPSS can be intimidating. The menus look endless, syntax can be cryptic, and it’s easy to run tests incorrectly — leading to misleading results, wasted time, or poor grades.

This guide breaks down exactly what you need to know to analyze your data confidently in SPSS: what makes SPSS so powerful, common pitfalls to avoid, step-by-step essentials, and how getting professional help can elevate your project from “acceptable” to “outstanding.”
✅ Ready to get started? Fill out our form for a Free customised quote, and get help from an IBM SPSS expert — stress-free.
Why SPSS Remains the Gold Standard for Data Analysis
While other software like R and Python are rising stars for advanced analytics, SPSS remains a favorite in education, health, psychology, and social sciences. Why?
1. Intuitive Interface: Unlike purely code-based tools, SPSS uses point-and-click menus that make it accessible even for beginners. You can import a dataset, run tests, and generate charts without writing a single line of syntax.
2. Powerful Statistics for Everyday Research: SPSS covers nearly every method a student or applied researcher might need: descriptive statistics, t-tests, ANOVA, regression, non-parametric tests, factor analysis, reliability testing, and more.
3. Clean Output: SPSS organizes results into well-formatted tables and figures, which you can export directly into your report.
4. Standard in Academia: Most universities teach and expect students to use SPSS for theses, dissertations, and coursework.
At SPSSanalysis.com, our statisticians master not just the software but the reasoning behind each test — helping you interpret output correctly, not just generate it.
Common Challenges When Analyzing Data in SPSS
Even with its user-friendly design, SPSS can trip up users in surprising ways. Some of the most frequent issues we see include:
- Import headaches: Variables mislabeled or formatted incorrectly during Excel import.
- Missing data confusion: Students often don’t know how to detect, handle, or report missing values.
- Choosing the wrong test: Running a t-test when you should use ANOVA, or using parametric tests when assumptions aren’t met.
- Misinterpreting output: Confusing test statistics, significance levels, and effect sizes.
- Messy tables: Copy-pasting raw SPSS output instead of polishing it for clarity and style.
A little guidance goes a long way in avoiding these mistakes.

Getting Started: How to Prepare Your Data in SPSS
Before running any analysis, clean data is key. In SPSS, this means more than just importing your spreadsheet.
Steps for good data preparation:
- Label variables clearly: Use meaningful names for variables and add descriptive labels. This helps avoid confusion later.
- Set measurement levels correctly: Define whether a variable is nominal, ordinal, or scale. SPSS uses this to suggest valid tests.
- Check for missing values: Use the “Descriptives” or “Frequencies” tools to spot gaps or unexpected values.
- Recode or compute variables as needed: Create new variables for grouped data, dummy coding, or calculated fields.
- Save regularly: Always keep a backup before recoding or transforming data.
Proper preparation means your tests will run smoothly, and your results will be trustworthy.
✅ Ready to get started? Fill out our form for a Free customised quote, and get help from an IBM SPSS expert — stress-free.
Essential Analyses You Can Run in SPSS
SPSS can handle a wide range of statistical techniques. Here are a few essentials you’ll likely encounter, and what they do:
- Descriptive Statistics: Summarize your data: means, medians, standard deviations, and frequency tables. Always start here — it helps you spot errors early.
- One-sample t-test: Compare a sample mean to a known value.
- Independent-samples t-test: Compare two unrelated groups.
- Paired-samples t-test: Compare two related measures (e.g., before and after treatment).
- ANOVA (Analysis of Variance): Test for mean differences among three or more groups. Post-hoc tests help pinpoint where differences lie.
- Correlation: Examine the strength and direction of the relationship between two continuous variables.
- Regression: Predict one variable based on one or more predictors. SPSS handles simple linear regression up to complex multiple regression.
- Non-Parametric Tests: When your data don’t meet normality assumptions, non-parametric options like Mann-Whitney U or Kruskal-Wallis provide valid alternatives.
Understanding which test matches your research question is half the battle — the other half is interpreting it properly, which is where expert help saves you time.
✅ Ready to get started? Fill out our form for a Free customised quote, and get help from an IBM SPSS expert — stress-free.
Interpreting SPSS Output: What Really Matters
One strength of SPSS is the wealth of output it provides. But too much information can overwhelm.
Focus on key elements:
- Test statistic: (e.g., t, F, chi-square) shows the computed value from your sample.
- Degrees of freedom: Important for understanding the reliability of your test.
- Significance level (p-value): Tells you whether to reject the null hypothesis.
- Effect size: Indicates how big or meaningful the difference or relationship is.
- Confidence intervals: Show the range where the true population parameter likely falls.

At SPSSanalysis.com, we help you separate the signal from the noise and craft clear results paragraphs that impress supervisors or reviewers.
Presenting Results: From SPSS Tables to Polished Reports
Don’t paste raw SPSS tables into your paper! Markers and journal editors expect clean, easy-to-read presentation.
Tips for clean reporting:
- Use APA, AMA, or your field’s required style.
- Remove unnecessary rows or columns.
- Round to two or three decimal places consistently.
- Add clear titles, notes, and explain abbreviations.
We help clients format publication-ready tables and figures, ensuring your findings look as professional as your analysis.
Handling Missing Data and Outliers in SPSS
Real-world data is rarely perfect. Ignoring missing values or outliers can bias your results.
In SPSS, you can:
- Use “Explore” or “Descriptives” to identify outliers.
- Replace missing values with mean substitution or more advanced imputation.
- Run analyses with or without outliers to check robustness.
Expert statisticians choose the best method based on your data and research question — one size never fits all.
Advanced Tools: Going Beyond the Basics
For more complex studies, SPSS offers advanced modules:
- Factor Analysis: Reduce many variables into underlying factors.
- Reliability Analysis: Check the consistency of survey scales (e.g., Cronbach’s alpha).
- Multivariate tests: MANOVA, discriminant analysis, cluster analysis.
These unlock deeper insights but require careful planning and interpretation. If you’re unsure, professional support avoids costly errors.
✅ Ready to get started? Fill out our form for a Free customised quote, and get help from an IBM SPSS expert — stress-free.
Why Students and Researchers Trust SPSSanalysis.com
When deadlines are tight and stakes are high, guessing your way through SPSS is risky. Thousands of students, academic researchers, and professionals turn to SPSSanalysis.com because:
- We don’t just run tests — we teach you what they mean.
- Our team has advanced degrees and years of hands-on SPSS experience.
- We format clean tables and draft clear results sections.
- Confidentiality is guaranteed — your data stays safe and private.
- Our support adapts to your timeline, from urgent checks to in-depth projects.
Whether you need a one-off test or end-to-end data analysis, we’re here to help you succeed.
How to Get SPSS Data Analysis Help
Working with us is simple:
- Request a free quote — tell us your research question, deadline, and attach your data if ready.
- Receive a clear, personalized plan and cost within 24 hours.
- Approve and pay securely.
- Our experts run, check, and format your analysis.
- Get a polished results file and an explanation you can use directly in your report.

This approach saves you hours of stress and boosts your confidence in defending your findings.
Final Thoughts: Mastering Data Analysis Using SPSS
SPSS is a powerful tool — but power means little without clarity and accuracy. By learning the basics and partnering with the right experts, you ensure your results are robust, your conclusions credible, and your final report something to be proud of.
Don’t leave your grades, research reputation, or business insights to chance. Start today: request your free SPSS quote and see how easy data analysis can be when you have trusted support.
Stay connected with SPSSanalysis.com on LinkedIn for the latest updates and insights!


