Linear Interpolation Imputation in SPSS
Discover Linear Interpolation Imputation for Missing Data in SPSS! Learn how to perform, understand SPSS output, and report results in APA style. Check out this simple, easy-to-follow guide below for a quick read!
Struggling with Replacing Missing Values in SPSS! We’re here to help. We provide comprehensive support to academics and PhD students, encompassing assignments, dissertations, research, and additional services. Request Quote Now!
1. Introduction
Missing data can reduce statistical power and bias the results of your analysis, especially in time-ordered or sequential datasets. One simple yet effective method for addressing missing values in such datasets is linear interpolation. This method is especially useful when values are missing in the middle of a series. In this guide, we explain how linear interpolation works, its assumptions, and how to apply it using SPSS.
2. What is Missing Data?
Missing data refers to the absence of information for one or more variables in a dataset. It can occur randomly or follow patterns, and it can be classified into three categories:
-
MCAR (Missing Completely at Random): The probability of missingness is unrelated to any observed or unobserved data.
-
MAR (Missing at Random): Missingness depends on other observed variables.
-
MNAR (Missing Not at Random): Missingness depends on the value itself or unobserved data.
Understanding the type of missingness is crucial for selecting an appropriate imputation strategy.
3. How to Handle Missing Data in SPSS
SPSS offers a variety of tools to address missing data, grouped into two main categories: single imputation and multiple imputation. Choosing the right approach depends on the amount of missingness, the underlying missing data mechanism (MCAR, MAR, MNAR), and the analysis goals.
I. Single Imputation Methods (via “Replace Missing Values” in SPSS)
These techniques substitute each missing value with a single estimate based on existing data:
-
Series Mean: Replaces all missing values in a variable with the overall mean of that variable. Best for normally distributed variables with low missingness.
-
Mean of Nearby Points: Uses the mean of adjacent (neighboring) values, which can be useful for time-series or ordered data.
-
Median of Nearby Points: Similar to the above, but uses the median instead of the mean, making it more robust to outliers.
-
Linear Interpolation: Fills in missing values using a straight line between two known data points. Works well when values are missing in the middle of a sequence.
-
Linear Trend at Point: Applies a linear regression model to predict the missing value at a specific point based on the trend of the variable across time or order.
These methods are quick and easy to implement, but they do not reflect uncertainty, and may bias standard errors or reduce variability in your dataset.
II. Multiple Imputation Methods (via “Multiple Imputation” in SPSS)
Unlike single imputation, multiple imputation creates several different plausible values for each missing data point, generating multiple complete datasets. The results from these datasets are then pooled for final analysis, allowing better estimation of uncertainty due to missing data. SPSS uses the MCMC and FCS (Fully Conditional Specification) frameworks to perform multiple imputation.
Here are the common methods:
-
FCS / MICE (Multiple Imputation by Chained Equations): This is the default in SPSS. Each variable with missing data is imputed conditionally based on a regression model using the other variables. This is flexible and supports both continuous and categorical data.
Best when data are Missing at Random (MAR) and the relationships among variables are important to preserve.
-
Predictive Mean Matching (PMM): A variation of regression imputation that ensures the imputed value is a realistic value from the observed dataset. It selects an observed value from cases with similar predicted values.
Useful when you want to avoid unrealistic or out-of-range imputed values.
-
Bayesian Estimation: Introduces randomness by sampling from a posterior distribution of parameters. This allows the imputations to reflect both model uncertainty and missingness.
Suitable for advanced users working under MAR assumptions or when modeling uncertainty is critical.
Multiple imputation is recommended when:
-
More than 5–10% of the data are missing
-
You assume data are MAR
-
You need valid inferences for regression, hypothesis testing, or model building
While more computationally intensive, multiple imputation provides more accurate standard errors and better preserves data relationships compared to single imputation.
4. Why Handling Missing Values Is Important in Statistical Analysis?
Failing to address missing data properly can lead to:
-
Biased estimates: If missingness is not random, ignoring it can distort your results.
-
Reduced statistical power: Loss of data means less information, resulting in wider confidence intervals and weaker significance.
-
Invalid assumptions: Many statistical models assume complete data. Violating this can compromise model validity.
By handling missing data thoughtfully—starting with an appropriate imputation strategy—you can ensure more reliable and interpretable results.
5. What is Linear Interpolation for Missing Data in SPSS?
Linear interpolation imputation replaces missing values by estimating them based on a straight-line relationship between the nearest observed values before and after the missing point. It is typically used for continuous numeric variables, especially when data points represent a natural order such as time, measurement intervals, or stages.
For example, if Time 1 = 10 and Time 3 = 20, the missing value at Time 2 will be estimated as 15 using linear interpolation.
In SPSS, this method can be accessed through the Replace Missing Values function by selecting the Linear Interpolation option under method.
6. What Are the Assumptions of Linear Interpolation Imputation?
Before applying linear interpolation, ensure the following assumptions are met:
-
The variable is continuous and ordered: Interpolation assumes a logical progression between values.
-
Missing values occur between two known values: This method cannot impute values at the beginning or end of the series without adjacent data points.
-
The trend between known values is approximately linear: The more linear the relationship, the more accurate the imputation.
It is not suitable for categorical or nominal data, and it assumes that the change between two known points is consistent and gradual.
7. An Example for Linear Interpolation Imputation
Imagine a dataset tracking weekly body weight (in kg) of 10 participants over 6 weeks as part of a fitness intervention study. Due to participant availability, some weight measurements are missing in the middle of the series. Below is a simplified version of one participant’s data:
| Week | Weight (kg) |
|---|---|
| 1 | 82.0 |
| 2 | 81.2 |
| 3 | Missing |
| 4 | Missing |
| 5 | 79.0 |
| 6 | 78.4 |
In this case, linear interpolation will estimate the missing values for Week 3 and Week 4 by assuming a straight-line trend between Week 2 (81.2 kg) and Week 5 (79.0 kg). The interpolated values would be:
-
Week 3 = 80.47 kg
-
Week 4 = 79.73 kg
These values are calculated using equal spacing between known points and help retain the smooth downward trend in weight without introducing artificial jumps. SPSS will compute and fill these values automatically using the Linear Interpolation method in the Replace Missing Values function, creating a new complete variable (e.g., Weight_Interpolated) without modifying the original data.
This example highlights how linear interpolation is especially helpful for time-series or longitudinal data where measurements are expected to follow gradual trends.
8. How to Perform Linear Interpolation Imputation


Step by Step: Running Linear Interpolation Imputation in SPSS Statistics
Let’s embark on a step-by-step guide on performing the Replacement of Missing Values using SPSS
To apply linear interpolation imputation in SPSS, follow these steps:
1. Step: Open your dataset in SPSS.
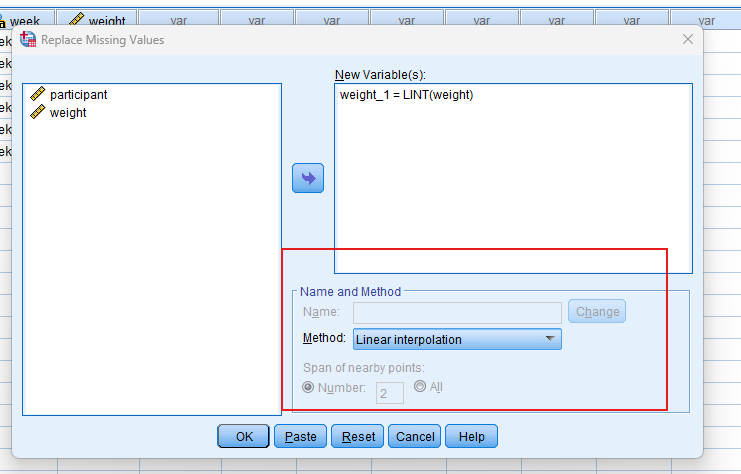
2. Step: Go to Transform → Replace Missing Values.
3. Step: In the dialog box, select the numeric variable you want to impute (e.g., weight).
4. Step: From the “Method” dropdown, select Linear Interpolation.
5. Step: Click “OK.” SPSS will create a new variable (e.g., weight_1) with missing values replaced using interpolation.
Ensure your data is sorted in the correct order (e.g., by time or case ID) before running this procedure, as interpolation relies on sequential ordering.
Note: Conducting Replacing Missing Values in SPSS provides a robust foundation for understanding the key features of your data. Always ensure that you consult the documentation corresponding to your SPSS version, as steps might slightly differ based on the software version in use.
This guide is tailored for SPSS version 25, and for any variations, it’s recommended to refer to the software’s documentation for accurate and updated instructions.
9. SPSS Output for Replacing Missing Values
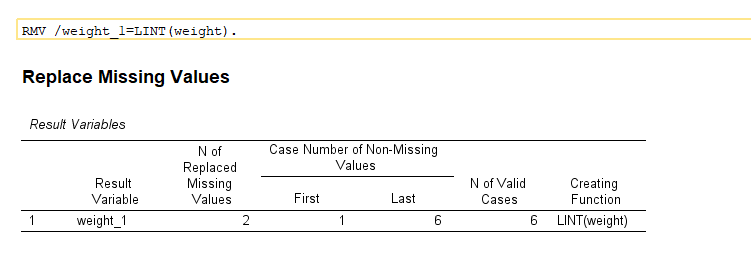
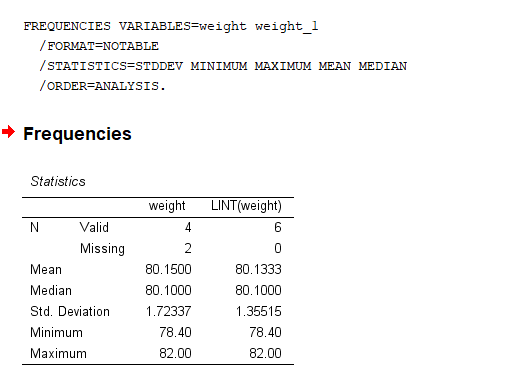
10. How to Interpret SPSS Output for Linear Interpolation Imputation
SPSS does not generate a dedicated output window when performing linear interpolation. However, you can verify the success of the imputation using:
-
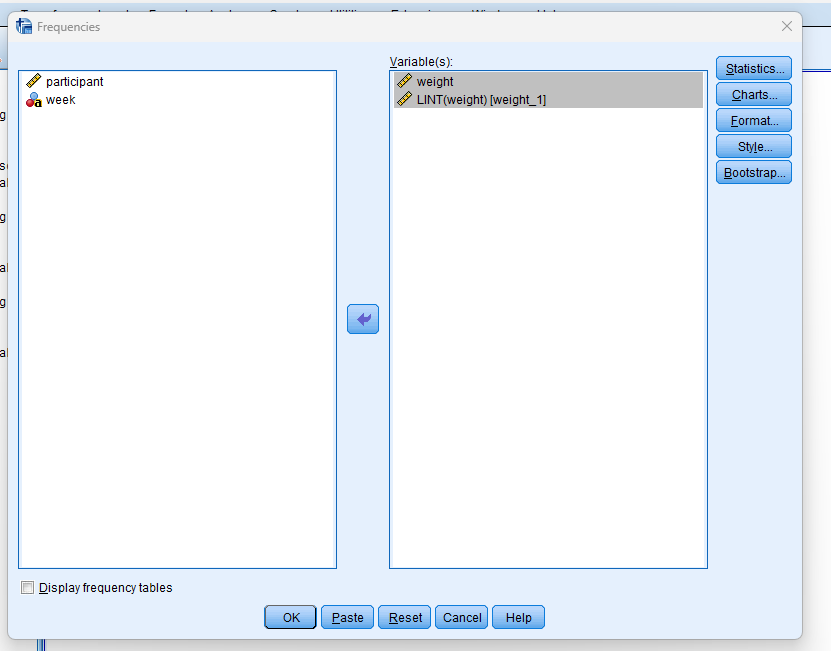
Descriptive Statistics (Analyze → Descriptive Statistics → Descriptives) to compare the original and imputed variables.
-
Missing value counts: The new variable should have 0 missing values.
-
Line plots or sequence charts: Visualize the trend before and after imputation to ensure that the pattern appears continuous and smooth.
11. How to Report Linear Interpolation Imputation Results
When reporting the use of linear interpolation in academic papers or reports, include the following points:
-
State the variable and number of missing values.
-
Explain why interpolation was chosen (e.g., time-ordered data with intermediate missing values).
-
Mention the imputation method and software used.
-
Clarify that a new variable was created and that observed values remained unchanged.
-
Note any assumptions or limitations (e.g., interpolation may not account for nonlinear trends).
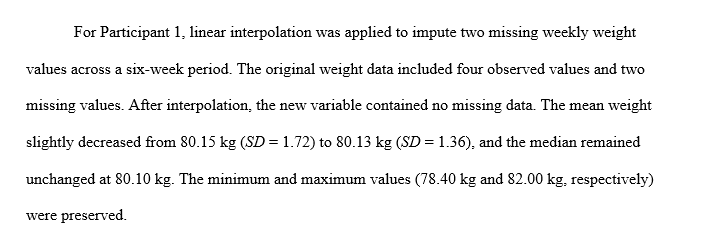
Example of Linear Interpolation Results in APA Style
Get Help For Your SPSS Analysis
Embark on a seamless research journey with SPSSAnalysis.com, where our dedicated team provides expert data analysis assistance for students, academicians, and individuals. We ensure your research is elevated with precision. Explore our pages;
- SPSS Help by Subjects Area: Psychology, Sociology, Nursing, Education, Medical, Healthcare, Epidemiology, Marketing
- Dissertation Methodology Help
- Dissertation Data Analysis Help
- Dissertation Results Help
- Pay Someone to Do My Data Analysis
- Hire a Statistician for Dissertation
- Statistics Help for DNP Dissertation
- Pay Someone to Do My Dissertation Statistics
Connect with us at SPSSAnalysis.com to empower your research endeavors and achieve impactful data analysis results. Get a FREE Quote Today!