Repeated Measures ANOVA in SPSS
Discover Repeated Measures ANOVA in SPSS! Learn how to perform, understand SPSS output, and report results in APA style. Check out this simple, easy-to-follow guide below for a quick read!
Struggling with the Repeated Measures ANOVA Test in SPSS? We’re here to help. We offer comprehensive assistance to students, covering assignments, dissertations, research, and more. Request Quote Now!

Introduction
Embarking on the exploration of statistical analysis, this blog post demystifies the intricacies of Repeated Measures ANOVA in SPSS, offering researchers a powerful tool to unravel temporal changes or within-subject variations across different experimental conditions. Repeated Measures ANOVA, also known as Repeated Measure Analysis of Variance, stands as a robust statistical technique for scenarios where the same subjects are measured under multiple conditions. As we delve into this post, we’ll journey through the definition, assumptions, hypotheses, and practical application of Repeated Measures ANOVA. Whether you’re a seasoned statistician or a newcomer to the world of repeated measures, this post equips you with the knowledge to navigate SPSS, interpret results, and eloquently report findings in APA style.
Definition
Repeated Measures ANOVA serves as a statistical method designed to assess the impact of one or more independent variables on a dependent variable measured repeatedly over time or under different conditions. Unlike traditional ANOVA, Repeated Measures ANOVA considers the interdependence of observations within the same subjects, making it especially valuable in experimental designs involving pre-tests and post-tests or interventions at various time points. In the following sections, we’ll unravel the assumptions crucial for the application of Repeated Measures ANOVA, formulate hypotheses, present a practical example, and guide you through the step-by-step process of executing and interpreting the analysis in SPSS.
Assumption of Repeated Measures ANOVA
To ensure the reliability and accuracy of Repeated Measures ANOVA results, researchers must consider and validate several assumptions. These assumptions serve as the foundation for the robustness of the analysis. Here are the key assumptions to be mindful of:
- Sphericity: The variances of the differences between all possible pairs of within-subject conditions should be equal. Sphericity ensures that the differences in variances are consistent across conditions.
- Homogeneity of Variances: The variance of the differences between pairs of conditions should be constant across all levels of the independent variable. Homogeneity of variances ensures the reliability of the analysis.
- Normality: The distribution of the differences between conditions should be approximately normal within each level of the independent variable. Normality ensures the accuracy of statistical inferences.
- Linearity: The relationships between the dependent variable and independent variables should be linear. Linearity ensures that the impact of the independent variable is consistent across different levels.
The hypothesis of Repeated Measures ANOVA
The formulation of clear and precise hypotheses is crucial for the success of Repeated Measures ANOVA. These hypotheses guide researchers in assessing the impact of independent variables on dependent variables measured repeatedly. The hypotheses are structured as follows:
- Null Hypothesis: There are no significant differences in the means of the dependent variable across different levels of the independent variable over time or conditions.
- Alternative Hypothesis: There are significant differences in the means of the dependent variable across different levels of the independent variable over time or conditions.
These hypotheses guide researchers in exploring the impact of independent variables across repeated measures, paving the way for a nuanced understanding of temporal or within-subject variations. Now, let’s proceed to a practical example to illustrate the application of Repeated Measures ANOVA in a research context.
Example of Repeated Measure Analysis of Variance
Let’s consider a scenario where a clinical psychologist is conducting a study to evaluate the effectiveness of a stress reduction intervention over three-time points: baseline, week 1, and week 2. Participants undergo stress assessments at each time point to measure changes in stress levels after receiving the intervention.
In this study, a clinical psychologist aims to assess the impact of a stress reduction intervention over three-time points: baseline, week 1, and week 2. The repeated measures design allows for the examination of changes in stress levels within the same participants throughout the intervention.
Participants
Participants are individuals experiencing moderate to high levels of stress. Each participant undergoes stress assessments at baseline, week 1, and week 2 to establish a comprehensive understanding of the intervention’s impact on their stress levels.
Hypotheses
- Null Hypothesis: There are no significant differences in mean stress levels across the three-time points.
- Alternative Hypothesis: There are significant differences in mean stress levels across the three-time points, indicating an overall impact of the stress reduction intervention.
This scenario highlights how a repeated measures design can be applied to assess changes within individuals over time, offering valuable insights into the effectiveness of interventions designed to address specific outcomes.


Step by Step: Running Repeated Measure ANOVA in SPSS Statistics
Now, let’s delve into the step-by-step process of conducting the Repeated Measures ANOVA using SPSS. Here’s a step-by-step guide on how to perform a Repeated Measure Analysis of Variance (ANOVA) in SPSS:
- STEP: Load Data into SPSS
Commence by launching SPSS and loading your dataset, which should encompass the variables of interest – a categorical independent variable. If your data is not already in SPSS format, you can import it by navigating to File > Open > Data and selecting your data file.
- STEP: Access the Analyze Menu
In the top menu, locate and click on “Analyze.” Within the “Analyze” menu, navigate to “General Linear Model” and choose ” Multivariate” Analyze > General Linear Model> Repeated Mesures
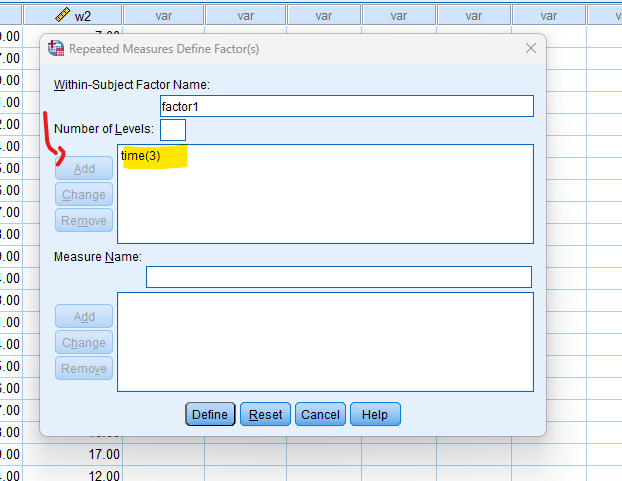
- STEP: Repeated Measures Define Variables
Specify the number of levels (repeated measures) for your within-subjects factor.
- Click on the “Add” button in the “Within-Subjects Factors” box.
- In the new window, enter the name of your within-subjects factor.
- Specify the number of levels (measurements) for this factor.
- Click “Add” and then “Define.”
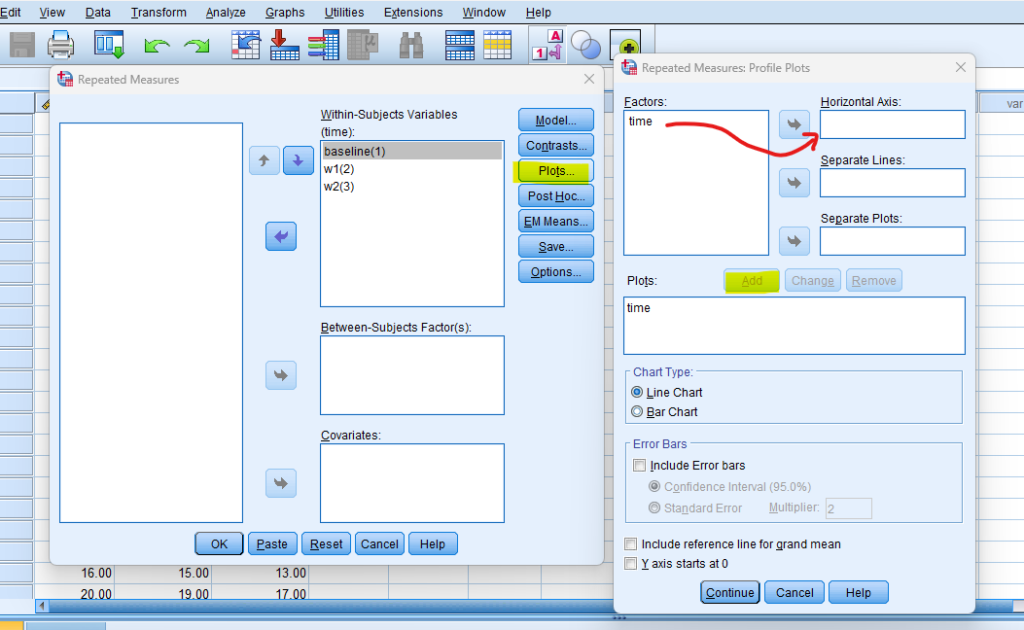
- STEP: Plots
Click on the “Plot” button, Move to Factor into the Horizontal Axis, and then click the “Add” button.
- STEP: Options
Snap on the “Options” button Check “Descriptive”, “Homogeneity Test” and “Estimates of effect size”
- STEP: Generate SPSS Output
Once you have specified your variables and chosen options, click the “OK” button to perform the analysis. SPSS will generate a comprehensive output, including the requested frequency table and chart for your dataset.
Executing these steps initiates the Repeated Measures ANOVA analysis in SPSS, allowing researchers to assess the impact of the teaching method on students’ test scores while considering the repeated measures. In the next section, we will delve into the interpretation of SPSS output for Repeated Measures ANOVA.
Note
Conducting a One-Way ANOVA test in SPSS provides a robust foundation for understanding the key features of your data. Always ensure that you consult the documentation corresponding to your SPSS version, as steps might slightly differ based on the software version in use. This guide is tailored for SPSS version 25, and for any variations, it’s recommended to refer to the software’s documentation for accurate and updated instructions.
SPSS Output for Repeated Measures Analysis of Variance


How to Interpret SPSS Output of Repeated Measures ANOVA
Interpreting the SPSS output for Repeated Measures ANOVA involves a thorough examination of several key components to draw meaningful conclusions about the impact of independent variables on repeated measures. Here are the critical elements to focus on:
Descriptives Table
- Mean and Standard Deviation: Evaluate the means and standard deviations of each group. This provides an initial overview of the central tendency and variability within each group.
- Sample Size (N): Confirm the number of observations in each group. Discrepancies in sample sizes could impact the interpretation.
Multivariate Tests Table
Multivariate Tests table for additional statistical information, including Wilks’ Lambda Test, Pillai’s Trace, Hotelling’s Trace, and Roy’s Largest Root. These tests contribute to the overall assessment of the impact of the independent variable.
- Wilks’ Lambda test: A significant result indicates that there are significant differences in the multivariate pattern of the dependent variables across the levels of the independent variable.
Mauchly’s Test of Sphericity
- Mauchly: Begin by reviewing Mauchly’s test of sphericity. This test assesses the assumption that the variances of the differences between pairs of within-subject conditions are equal. A non-significant result is preferable, indicating that the assumption of sphericity is met.
- Greenhouse-Geisser or Huynh-Feldt Correction: If Mauchly’s test is significant, consider the Greenhouse-Geisser or Huynh-Feldt correction factors to adjust for violations of the sphericity assumption.
Tests of Within-Subjects Effects
Inspect the “Tests of Within-Subjects Effects” table, which provides information on the significance of the main effect of the independent variable and any interaction effects. Look for the p-values associated with these effects.
- Within-Groups: Move on to the ANOVA table, which displays the Within-Groups, degrees of freedom, mean squares, the F-ratio, and the p-value.
- F-Ratio: Focus on the F-ratio. A higher F-ratio indicates larger differences among group means relative to within-group variability.
- Degrees of Freedom: Note the degrees of freedom for Within-Groups. These values are essential for calculating the critical F-value.
- P-Value: Examine the p-value associated with the F-ratio. If the p-value is below your chosen significance level (commonly 0.05), it suggests that at least one group mean is significantly different.
- Eta-squared: If available, consider effect size measures in the ANOVA table. Eta-squared indicates the proportion of variance in the dependent variable explained by the group differences.
Post Hoc Tests Table (If Applied):
- Specific Group Differences: If you conducted post-hoc tests, examine the results. Look for significant differences between specific pairs of groups. Pay attention to p-values and confidence intervals to identify which groups are significantly different from each other.
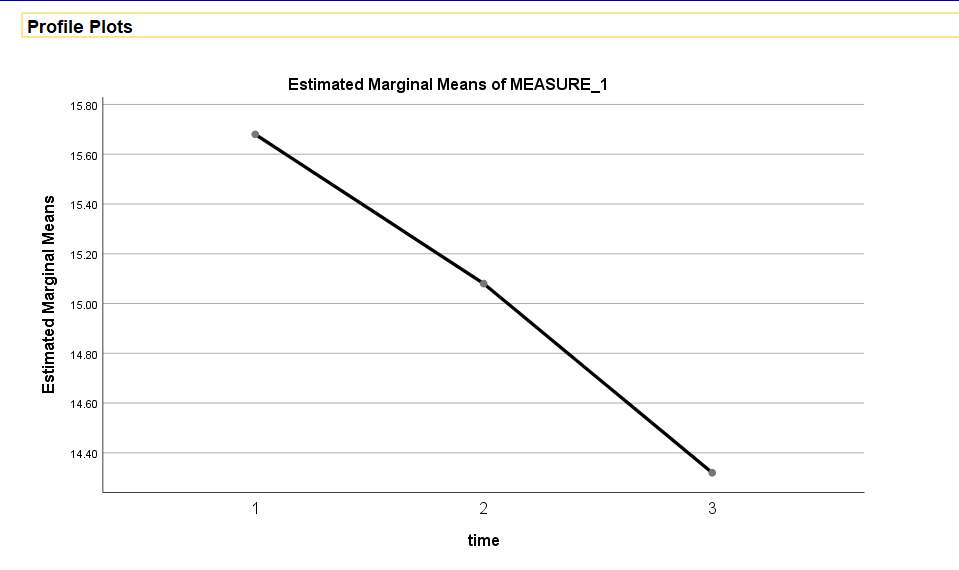
Profile Plots (Optional):
- Line Plot: If profile plots are generated, inspect them to visualize the mean differences across levels of the independent variable.
By meticulously examining these components, researchers gain insights into the impact of teaching methods on test scores over repeated measures, considering the assumptions and potential corrections. In the final section, we will guide you on reporting the results of Repeated Measures ANOVA in APA style, ensuring a clear and structured presentation of your findings.
How to Report Results of Repeated Measures ANOVA in APA
Reporting the results of Repeated Measures ANOVA in APA style involves succinctly summarising key findings while adhering to a specific format. Here’s a template for reporting results:
- Introduction: Begin by introducing the analysis conducted, specifying that a Repeated Measures ANOVA was employed to examine the impact of the independent variable (teaching method) on the repeated measures of the dependent variable (test scores).
- Descriptive Statistics: Provide descriptive statistics such as means and standard deviations for each level of the independent variable.
- Sphericity Assumption: If applicable, report the result of Mauchly’s test of sphericity. For instance, “Mauchly’s test indicated that the assumption of sphericity was (violated or met) with a significance level of p = X.”
- Main Effects: Report the main effects of the independent variable on the dependent variable. For example, “There was a significant main effect of teaching method on test scores, F(df1, df2) = F-value, p = X.”
- Interaction Effects (If Applicable): If there are interaction effects, report them. For instance, “Additionally, there was a significant interaction between teaching method and time, F(df1, df2) = F-value, p = X.”
- Post-Hoc Tests (If Applicable): If post-hoc tests were conducted, report the results. For example, “Post-hoc tests using (specified correction method) revealed that (specific teaching method) significantly differed from (other teaching methods) in terms of test scores.”
- Effect Size: Consider reporting effect size measures such as partial eta-squared (η²) to quantify the magnitude of the observed effects.
By following this reporting template, you ensure a clear and structured presentation of your Repeated Measures ANOVA results in APA style. This not only communicates your findings effectively but also maintains the standards of academic writing.

Get Help For Your SPSS Analysis
Embark on a seamless research journey with SPSSAnalysis.com, where our dedicated team provides expert data analysis assistance for students, academicians, and individuals. We ensure your research is elevated with precision. Explore our pages;
- SPSS Data Analysis Help – SPSS Helper,
- Quantitative Analysis Help,
- Qualitative Analysis Help,
- SPSS Dissertation Analysis Help,
- Dissertation Statistics Help,
- Statistical Analysis Help,
- Medical Data Analysis Help.
Connect with us at SPSSAnalysis.com to empower your research endeavors and achieve impactful results. Get a Free Quote Today!